The Best Android Mobile Benchmarks
July 30, 2016 1 Comment
Although there is strong evidence that higher benchmark scores do not always translate into real-world performance gains, the best benchmarks do serve a purpose. They are not subjective and can expose differences in hardware performance. Unfortunately, there are over fifty different mobile benchmarks to choose from, and picking the best ones is not easy. There are several reasons for this. Some benchmarks have serious problems and do not produce meaningful results. Other benchmarks haven’t been updated in years and should be taken down. A few benchmarks are bankrolled by companies with a long history of cheating. In the end, my research showed there are 4 or 5 benchmarks that really stand out and deserve a “Best” rating. A few others are very good, but not quite as good as the those with a “Best” rating. I found quite a few benchmarks that are good for certain things, so I placed them in their own category. Lastly, I found more than a few apps that have serious flaws and shouldn’t be used. Here are rankings of mobile benchmarks that will help you determine which to use, and which to avoid. This article is focused on Android benchmarks, but quite a few of these are available for iOS as well.
Best
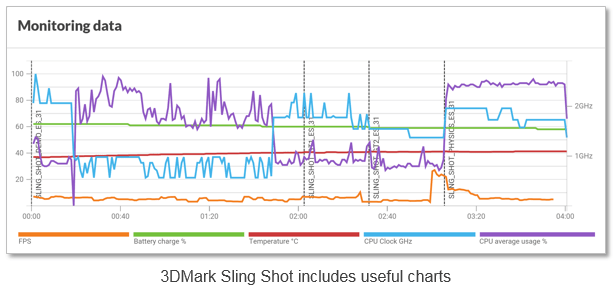
- 3DMark (Sling Shot) – One of the best GPU benchmarks. It incorporates volumetric lighting and particle illumination, as well as depth of field and bloom post-processing effects. Expect really low frame rates on the graphic tests. Although Sling Shot includes several good tests where physics including simulated worlds and particle systems are computed on the CPU, it isn’t the best benchmark for overall CPU performance. A useful graph is displayed after the test is complete, which plots the CPU frequency, temperature, frame rate for each of the tests. Scores vary depending on which of the modules you run. Even though the tests appear similar, scores from ES 3.1 mode should not be compared to scores from ES 3.0 mode. Requires Android 5.0 (or later).
- GFXBench (formerly GL Benchmark) – This suite of 14 different tests is one of the best GPU benchmarks. Its “Car Chase” test was the first to test devices with hardware tessellation support. It also includes HDR tone mapping bloom, lens flares, particles, motion blur and more. Issue: Temperature and clock speed are not reported on devices like the Nexus 6.
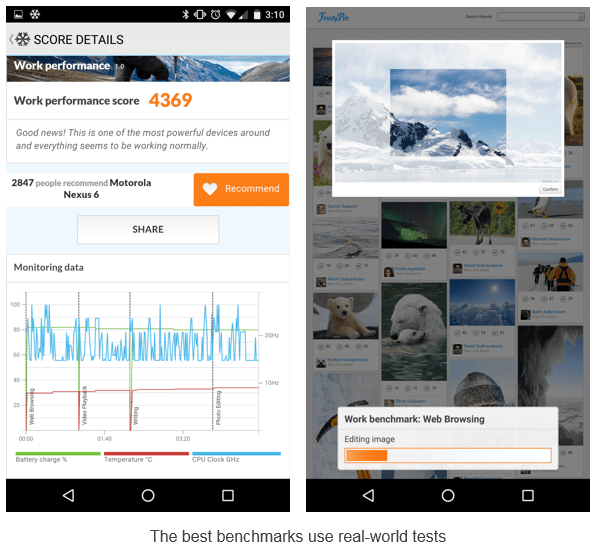
- PCMark for Android – This benchmark measures the performance and battery life of an Android device browsing the web, editing photos, watching videos and working with documents. Real applications are used, so the results are supposed to reflect real-world performance. The “Work battery life” test measures the time required to drain the battery in a device from full charge to 20%. This benchmark is useful, but isn’t a true test of processor efficiency, because the end result has a lot to do with the capacity of the battery in the device. Still, it’s one of the best battery tests.
- Vellamo – One of the best mobile web benchmarks. Although it’s known for its HTML5 and Javascript browser performance tests, the Browser Chapter also includes SunSpider and Google’s Octane benchmark, as well as page load, text reflo, scrolling and crypto tests. Vellamo also has a good collection of multi-core benchmarks (Multicore chapter) which include Linpack, Sysbench and Threadbench. Lastly, Vellamo’s Metal chapter includes the Dhrystone and Linpack benchmarks, as well as storage and RAM memory tests. It should be mentioned that the person who created and maintains Vellamo is an employee of Qualcomm, although I’ve never seen any evidence Vellamo’s browser tests favor Snapdragon processors.
Very Good
- Androbench – A good way to measure the storage performance on an Android device. Measures sequential reads/writes and random reads/writes.
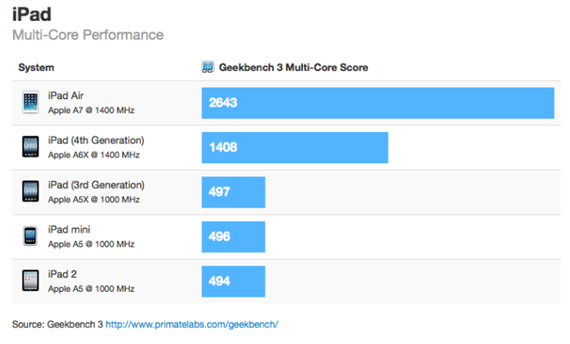
- Geekbench 4 – One of the better single-core CPU benchmarks. Geekbench also tests memory and multi-core performance. Geekbench 4 also includes new GPU compute tests, although it’s too soon to say how good these tests are. Requires Android 5.0 or later.
- JetStream – A relatively new JavaScript benchmark that is similar to Vellamo and PCMark’s Web Browsing test. Effectively replaces SunSpider and Octane because it includes SunSpider 1. 0.2 and Octane 2. Its makers claim it is better because “each benchmark measures a distinct workload, and no single optimization technique is sufficient to speed up all benchmarks.” Latency tests confirm that a web application can start quickly, ramp up to peak performance, and run smoothly without interruptions. Throughput tests measure the sustained peak performance of a web application. It’s supposed to be less easy to game because aggressive optimizations for one benchmark could make another benchmark slower.
Useful in Some Cases
- 4GMark – A speed and quality of service benchmark for 2G/3G/4G cellular and Wi-Fi networks. After testing, you can compare your results against other users in your country, area, or the same device.
- AndEBench-Pro 2015 – A suite of tests measuring CPU, GPU, memory and storage performance. It also gauges XML parsing, GUI rendering, image manipulation, data compression and cryptography tasks embedded in actual workloads. This benchmark is a product of EEMBC, which is led by Intel. This apps is based on AndEBench, which gets only 3 stars in Google Play. It was last updated in 2015 for Lollipop and is overdue for an update.
- AnTuTu 6.0 – Better as a CPU test than a GPU test. AnTuTu is also not a good indicator of performance changes over time because its scores sometimes change dramatically as new versions are released. For example, bloggers benchmarking the Snapdragon 820 with AnTuTu 6.0 saw scores over 130,000. At the same event, on the same hardware, AnTuTu 5.7 reported scores around 70,000. That’s almost a 2x increase, which makes this benchmark very misleading. Although some of the best tech bloggers (e.g. AnandTech, Engadget and Ars Technica) no longer use AnTuTu, it’s still one the most popular Android benchmarks and the one that handset manufacturers like Samsung value the most. It also has more users than any other benchmark. For these reasons, I’m not moving it to the ‘Not Recommended’ section of this article – even though it probably deserves to be there.
- Basemark ES 3.1 – Measures the OpenGL ES 3.1 graphics performance of your device. Also provides four results: Lighting, Compute, Instancing and Post-Processing. It’s part of their Basemark GPU Mobile test suite , which has a Pro version that reports FPS and other stats. I considered moving this to the “Good” section of this article, but after reading its mixed reviews and seeing that it doesn’t run on most mobile devices, I’m leaving it here for now.
- DiscoMark – This little-known benchmark measures the launch-times of applications that you select. On the plus side, this test reflects the real-world performance of your phone. On the negative side, comparisons are meaningless, unless the same apps are selected.
- Basemark GUI Free – Performs vertex streaming and blending performance measurements. Its vertex test is good, although the blend test is not great. It also hasn’t been updated since 2014.
- Basemark X – A decent cross-platform graphics benchmark based on the Unity 4.2 game engine. This used to be one of the more demanding graphic benchmarks, but it hasn’t been updated since 2014, so it’s showing signs of age. Its off-screen test is also not completely resolution independent.
- CF-Bench – A CPU and memory benchmark designed for multi-core devices. Although it produces a “final” score, its creators say you should take those with a grain of salt. Hasn’t been updated since 2013.
- CompuBench RS – A RenderScript benchmark that tests compute performance of Android mobile devices. Still being updated, but not very popular.
- Dhrystone– An older synthetic computing benchmark program which provides an indication of CPU “integer” performance. This benchmark isn’t a good indicator of performance but is still used by some chip manufacturers as a load to determine peak power consumption. Dhystone 2.1 is part of Vellamo’s Metal Chapter.
- Epic Citadel isn’t a traditional benchmark, but it does have a “benchmark mode,” which reports an average frame rate after a game loop runs. I feel this app is useful because its graphics are representative of the real world games.
- GameBench – GameBench is one of the more popular FPS testing apps. However it must run for for 10-15 minutes in order to get a frame rate reading, and there is evidence the results are not always accurate. I wrote an article that compares GameBench with others apps that report frame rates. GameBench is “App 2” in these tests. Note: This app also has privacy issues. It sends your email address, test scores and other personal data to the cloud where paid users can access it.
- Google Octane– A good test of JavaScript performance in browsers. This test is part of JetStream and the Vellamo Browser Chapter, so most users won’t need to run it.
- Kraken– Yet another Java script benchmark. Still used by Ars Technica and some other bloggers.
- SPECint 2006 – This benchmark is used by chip manufacturers and OEMs to measure CPU performance. It contains 12 different benchmark tests that stress a system’s processor and memory subsystem. The reason this benchmark doesn’t appear in the above sections is because it’s not available in Google Play and costs $800.
- TabletMark – An automated tool that evaluates system performance on a range of activities, which include Web browsing, email, photo, video sharing and playback. Also includes a day-in-a-life battery test which includes idle time. While this benchmark sounds interesting, it’s worth mentioning that this app has less than 1000 downloads and a 3.6 star rating.
- Trepn Profiler – This app isn’t a benchmark, but it reports accurate power readings and displays the processor frequencies as an overlay on any app. This is a good way to see whether your processor is throttling under a heavy load. When a processor is overworked and gets too hot, its frequency is reduced, which causes a drop in performance. The only reason this app is not in the “good” category is because newer mobile processors (including the Snapdragon 808, 810, 820 and 821) have a PMIC that only reports power readings every 30 seconds and this can affect the accuracy of average power readings. [Disclosure: I was involved in the creation of this product]
Not Recommended
- 3DMark (Ice Storm) – Not the best test of advanced GPU performance. 3DMark Sling Shot has effectively replaced this test.
- AnTuTu 4.0 – This app has heavy vertex shader complexity that is unlike real-world games. It also has no consideration for tiled rendering architectures.
- AnTuTu 5.0 – This app’s 2D tests are not representative of the real-world games. This version was replaced by AnTuTu 6.0, which is better.
- Basemark OS II – A system-level benchmark designed to measuring overall performance. In addition to its overall score, four different areas are also evaluated including system, memory, graphics, and web browsing. Not recommended because the rankings on this Powerboard web site aren’t credible and their free version is missing several features promoted on their product page. Battery Test and External Memory Tests are available in their Full version, but I can’t find a camera test anywhere. Also, this benchmark hasn’t been updated since 2014 and it is one of the lower-ranked popular benchmarks on Google Play (3.9 stars).
- BenchmarkPi – One of several benchmarks that measures performance by calculating Pi. This benchmark isn’t recommended because it only tests the CPU and is no longer used by most bloggers. It also hasn’t been updated since 2009.
- BenchmarkXPRT – A collection of different benchmarks. You won’t find the word “Intel” on the BenchmarkXPRT website, but if you check the small print on some Intel websites you’ll find they admit “Intel is a sponsor and member of the BenchmarkXPRT Development Community, and was the major developer of the XPRT family of benchmarks.” Intel also says “Software and workloads used in performance tests may have been optimized for performance only on Intel microprocessors.” Bottom line: Intel made these benchmarks to make Intel processors look good and other processors look bad. This benchmark should not be used.
- BrowserMark – A cross-platform browser benchmark with issues that make cross-platform comparisons questionable.
- CaffeineMark – A series of online tests that measure the speed of Java programs. CaffeineMark scores roughly correlate with the number of Java instructions executed per second, and are not supposed to depend on the amount of memory available or the speed of the Internet connection. Not recommended, because this test was created in 1997 for PCs and their Android app hasn’t been updated since 2011. Much better JavaScript benchmarks now exist.
- CompuBench CL Mobile – Tests the compute performance of Android mobile devices supporting OpenCL. Tests include face detection, particle simulation, fractal rendering, ambient occlusion, raycast, gaussian blur and histogram normalization. Crashes on many devices. As a result it has a poor rating and cannot be installed on most devices.
- Google V8 – Another browser benchmark focused on JavaScript performance. Was effectively replaced by Google Octane because it adds five tests on top of the ones already in V8.
- Linpack – Measures the floating point performance of the CPU. Linpack is part of the Vellamo’s Multicore and Metal tests, so it’s not really needed. It’s also no longer used by most bloggers who benchmark and hasn’t been updated since 2011.
- MobileXPRT – You won’t find the word “Intel” on the BenchmarkXPRT website, but if you check the small print on some Intel websites you’ll find they admit “Intel is a sponsor and member of the BenchmarkXPRT Development Community, and was the major developer of the XPRT family of benchmarks.” Intel also says “Software and workloads used in performance tests may have been optimized for performance only on Intel microprocessors.” Bottom line: Intel made these benchmarks to make Intel processors look good and other processors look bad. MobileXPRT should not be used.
- Nenamark 1 – An OpenGL ES 2.0 graphic benchmark that is meaningless, because all modern devices hit its 60fps framerate limit. Hasn’t been updated since 2011.
- Nenamark 2 – An OpenGL ES 2.0 graphic benchmark that is supposed to have more advanced effects and higher resolution graphics than NenaMark1. Hasn’t been updated since 2012.
- Nenamark 3 – Another OpenGL ES benchmark that is supposed to continuously grow more complex until the system cannot handle it any more. However, it doesn’t allow you to change the resolution, so a phone with a very high-resolution screen is likely to perform worse than a budget phone with a low-resolution screen. This is also why it favors iPhone over Android flagships like the Nexus 6P.
- Passmark – Tests CPU, storage, 2D graphics, 3D graphics, storage and memory performance. Hasn’t been updated since 2013.
- Pi – Calculates how long it takes to calculate Pi up to 10 million digits. Not a useful benchmark because it only measures one thing.
- Quadrant Standard Edition – Mostly a CPU benchmark, although it also claims to test CPU, memory, I/O and graphics. Hasn’t been updated since 2012.
- Smartbench – A multi-core-friendly benchmark that measures overall performance. Tests productivity and gaming. Last updated in 2012. Poorly rated on Google Play (3.8 stars).
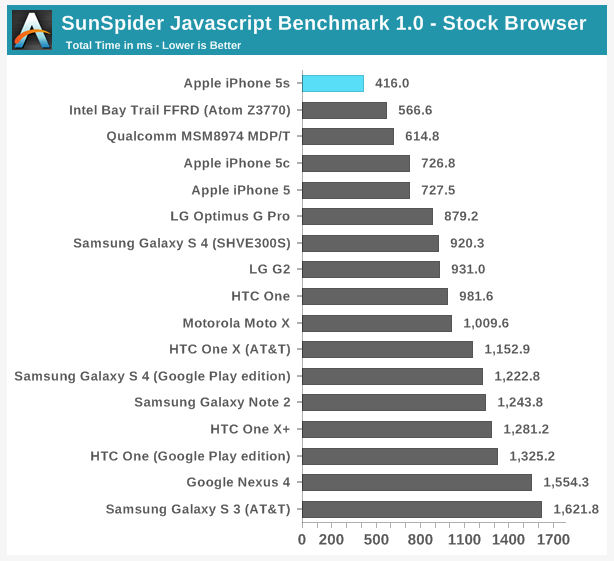
- SunSpider – The JavaScript benchmark SunSpider is no longer being updated. Its creators recommend JetStream. Even when it was still popular, the data that SunSpider used was so small that it was more of a cache test than a JavaScript benchmark.
- WebXPRT– You won’t find the word “Intel” on the BenchmarkXPRT website, but if you check the small print on some Intel websites you’ll find they admit “Intel is a sponsor and member of the BenchmarkXPRT Development Community, and was the major developer of the XPRT family of benchmarks.” Intel also says “Software and workloads used in performance tests may have been optimized for performance only on Intel microprocessors.” Bottom line: Intel made these benchmarks to make Intel processors look good and others look bad. WebXPRT should not be used.
I hope you find this article to be of use. If you have any comments please enter them below.
– Rick
Copyright 2016 Rick Schwartz. All rights reserved. Linking to this article is encouraged. All of the comments in this blog are Rick’s alone, and do not reflect the views of his employer.