Buying a Laptop for Audio Production

After several years of experiencing problems with my store-bought laptop while recording live shows, I finally decided it was time to buy a computer designed for audio recording. My previous laptop was an ASUS ROG with a 17-inch display. It’s old but was expensive when purchased and has an Intel i7 CPU, 16GB of high-speed RAM, and two 1TB Samsung 870 SSDs. I applied all the DAW tweaks like high-performance power mode, disabling unused services, and even placed it on an external cooling platform, but still it stopped recording at least four times on my last four shows.

The Search Begins

I started my search for a new music recording laptop looking at ASUS, Dell, and a few others. After compiling a 15-page list of audio optimization tips, I decided to investigate builders of laptops designed for music recording and production. For the past 20 years I’ve always built my own computers, but this time I wanted a laptop and didn’t have experience building those, I also wanted to see how professional laptop builders for DAWs optimize their machines.

The Right Stuff

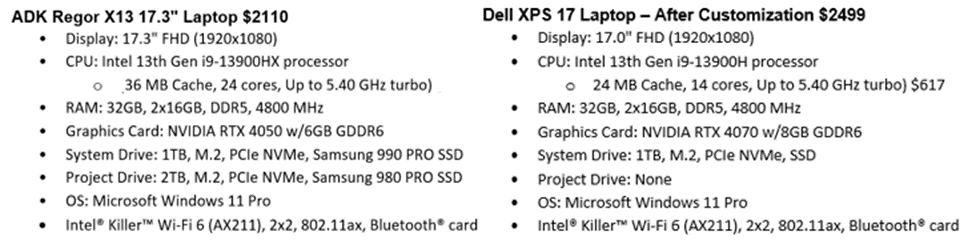
I started with ADK Pro Audio since I have been following them for more than 10 years and they are well respected in audio forums. I found a laptop configuration on their website that met my needs and budget. You can see it above. It has a 17” display and Thunderbolt 4. I upgraded the memory from 16 to 32 GB because I occasionally perform video editing and sometimes use virtual instruments. The extra memory will be helpful for these two use cases. I also upgraded the project drive from 1 to 2 TB because I want to keep this laptop for at least 5 years and don’t have to worry about running out of space. The total for the ADK laptop was $2110, which was a little more than I wanted to spend, so I went to the Dell website to see how much a similar configuration would cost there.

Apples-to-Apples

The Dell website lists four XPS 17 configs, I started with the cheapest one, which was only $1699 but needed the following upgrades to match my ADK laptop config:

  • Upgrade 1 (RAM): The base Dell XPS 17 only has 16 GB of RAM. Most DAWs will run fine with 16 GB, but it seemed foolish to me to not have extra RAM. If you have lots of virtual instruments, or ever plan to do video editing, you will get better performance if you have 32 GB of RAM. Upgrading the RAM added $150 to the Dell price, bringing the total to $1849.
  • Upgrade 2 (HD): The base Dell XPS has a 512 GB system drive, however both Dell and Tom’s Hardware recommend 1 TB for PCs designed for media creation. That’s probably why ADK has a 1 TB system driver selected by default. I was going to downgrade the ADK laptop system drive to 512 GB until I discovered the Samsung 990 Pro SSD is only available in 1 and 2 TB sizes. Also, with Windows 11, the more available space on your boot drive, the better the performance you get. Tests show that M.2 SSDs lose performance when only 10% of space remains. Some experts say you should keep 20% of available disk space free for best performance. Upgrading the system drive to 1 TB adds another $100, bringing the total to $1949.
  • Upgrade 3 (OS): The base Dell XPS configs come with Windows 11 Home, which doesn’t allow you to use Windows Group Policy to access tweaks like completely disabling system upgrades. This isn’t important to me, but Windows Pro is used by most audio PC builders, so I decided to add it to the Dell XPS, so it would be an apples-to-apples comparison with the ADK laptop. Switching the Dell XPS from Windows 11 Home to Windows 11 Pro only adds $50, bringing the total to $1999.
  • Upgrade 4 (CPU): The base Dell XPS 17, has an i7 processor. Upgrading it to an i9 processor costs an additional $400. One reason for the big increase in price is they also upgrade the graphics card from an NVIDIA RTX4050 with 6 GB, to an NVIDIA RTX 4070 with 8 GB. If you’re a gamer, this probably makes a big difference, but not for DAW users. It’s worth mentioning that the ADK laptop can be upgraded to the same graphics card for $306 more. So, to be fair, that brings the ADK laptop price up to $2416 for a true apples-to-apples comparison. After upgrading the processor, the total price for the Dell XPS 17 was $2,499.
  • Upgrade 5 (SSD 2): Lastly, the base Dell XPS 17 config doesn’t include a project drive, which is needed for maximum performance and extra space for recorded audio files and libraries. Sadly, there was no option to add a second M.2 drive on the Dell website. Purchasing a 2 TB M.2 SSD from Amazon costs $129, bringing the grand total for the Dell XPS 17 to $2628 before taxes. That’s $212 more than the ADK laptop with the same graphics card. Keep in mind that Dell, like most retailers charges you tax even if you are out of state increasing the total cost by $216 or more.

I expected the Dell laptop to be cheaper than the custom-built ADK laptop optimized for audio production because of Dell’s big purchasing power, Intel incentives and the money Dell makes from preinstalling lots of bloatware like antivirus software. In the end, the ADK laptop costs over $400 less when you include taxes.

Reasons I Choose ADK

  1. Extensive Audio Tweaks – I recently compiled a 15-page list of audio tweaks when I was considering making a new desktop for audio production. One problem is many of these tweaks can be traced back to Windows XP and some no longer make sense. Still, people blindly apply them – even though some could hurt audio performance.  One of the reasons I got the ADK laptop is because I wanted to see what the experts do with System, BIOS, and Group Policy settings. Dell doesn’t apply any tweaks needed for audio production. You can do this manually if you know what to do.
  2. No Bloatware – Every manufacturer adds bloatware that might include apps like McAfee LiveSafe, WinZip, TripAdvisor, WPS Office, Dropbox, Evernote, Norton Internet Security and more. One list of bloatware on Dell PCs shows 28 different apps in addition to the preceding ones that aren’t part of a clean Windows install. Microsoft installs additional bloatware on Windows 11 PCs, which may include: 3D Viewer, Adobe Express, Clipchamp, Facebook, Hidden City, Instagram, Netflix, News, Prime Video, Solitaire Collection, Mixed Reality Portal, Roblox, TikTok, Age of Empires: Castle Siege, Asphalt 8: Airborne, Bubble Witch 3 Saga, Candy Crush Saga, Candy Crush Friends Saga, FarmVille 2, Fitbit Coach, Gardenscapes, Phototastic Collage, PicsArt Photo Studio, Print 3D, Spotify, Twitter, Maps, Microsoft Feedback, Microsoft People, Movies & TV, Microsoft Tips, Microsoft Teams, Microsoft Skype, Xbox Game Bar and Phone Link. Some Windows PCs even annoy Windows users with ads that show up all over their operating systems. Other lists include Dell Customer Connect, Dell Digital Delivery, Dell PremierColor, Dell SupportAssist, Dell SupportAssist OS Recovery Plugin for Dell Update, Dell SupportAssist Remediation. Dell Update, Dolby Access, Dolby Vision Extensions, and My Dell as possible bloatware. This seems out of control to me. Some bloatware can be removed, others cannot. Custom system builders like ADK use a ‘vanilla’ copy of Windows 11 with no extra bloatware. This frees up memory usage and hard disk space. One user reported RAM usage on a 32 GB Dell XPS system dropped from 24% to 16% after removing all bloatware. Startup was also noticeably faster.
  3. More Cores & Cache – It’s worth mentioning that the Intel i9 processor in the ADK laptop has 10 more processor cores and an extra 12 MB of system cache. That is a big difference which should be noticeable for some applications.
  4. Higher Performance Components – To save money Dell uses several sources for each component, so you have no control and won’t know what you get unless you open your laptop. For example, the ADK laptop comes with a 1 TB Samsung 990 PRO NVMe M.2 SSD for the system drive.  Until recently, the Samsung 990 was the best M.2 drive you can buy. It’s still in the top 3. A recent review showed the Dell XPS with a 1 TB SSD got read speeds up to 7,109 MB/s and write speeds up to 6,421 MB/s. The ADK laptop’s internal Samsung 990 Pro SSD has read speeds of up to 7,450 MB/s and write speeds of up to 6,900 MB/s. That’s 5% faster for reads and 7% faster for writes. Not a huge deal, but every bit helps. Other Dell XPS 17 tear-downs show SSD drives with significantly lower performance. That’s why there are videos on YouTube that show how to upgrade Dell XPS laptops to Samsung SSDs for better performance.
  5. Better cooling – Dell chose to make the XPS 17 laptop look thinner, which makes it harder to cool. The ADK laptop has two large heat sinks on the rear and one large heat sink on each side. There are also two large vents on the bottom of the case. Dell also has a large vent on the bottom of the case, but much smaller heat sinks. They use a vapor chamber design in the XPS 17, with the chamber connected to fin arrays and dual blower fans that push air out the back and up in front of the display. Some reports say the Dell fans get loud in ultra-performance mode.
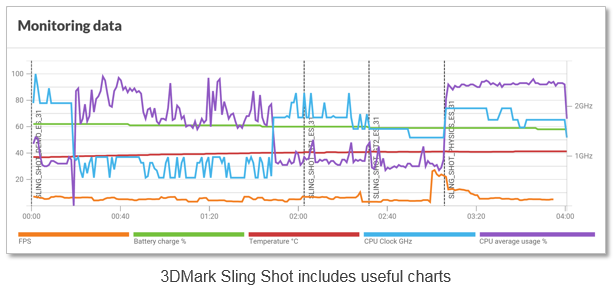
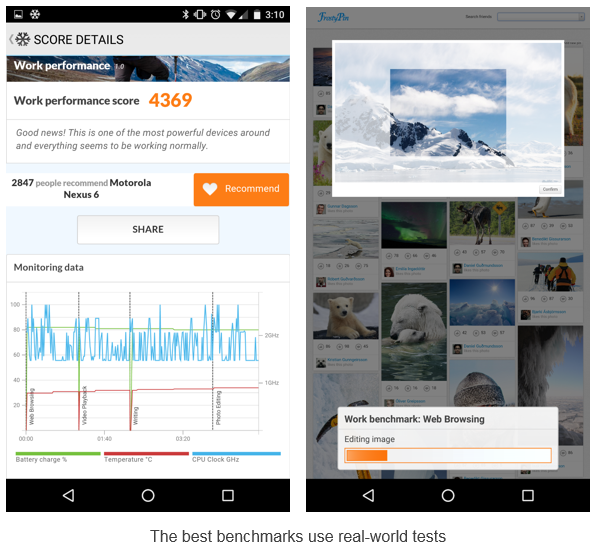
  6. System burn-in – System builders like ADK burn-in systems before shipping them. The burn-in tests eight different areas including CPU, 2D graphics, 3D graphics, System Disk, Sound, RAM, Networking, and video playback. The test only lasts 2 hours but performs trillions of different operations. During the burn-in period, the motherboard or graphics card on my laptop failed, so the company replaced both before sending the laptop to me.
  7. More ports – The Dell XPS 17 has only 5 ports. Four Thunderbolt ports and a 2-in-1 3.5mm headphone/microphone combo jack. The ADK laptop has 9 different ports as you can see below:

Left side ports

  • 2-in-1 Audio Jack (Headphone/Mic)
  • Microphone Jack – ADK provides a second mic-only jack.
  • USB 2.0 Port (Type A)
  • USB 3.2 Gen 1 Port (Type A)

Right side ports

  • Thunderbolt 4 Port (Type C)
  • RJ-45 LAN (10/100/1000Mbps) right side

Rear panel ports

  • USB 3.2 Gen 2 Port (Type C)
  • HDMI output Port with HDCP
  • Mini Display Port 1.4

The ADK laptop has several advantages in the port area.

  1. First, the ADK laptop has three rear panel ports, so you can connect your monitors and other peripherals without having a single cable hanging off the side of the laptop. This looks a lot better and the cables don’t get in the way as much.
  2. Second, you can connect a wired mouse or keyboard to the two Type-A ports without using an adapter like the one Dell provides. This is even more important because you are supposed to connect USB 2.0 devices to USB 2.0 ports and USB 3.0 devices to USB 3.0 ports. While you can connect one to the other, your device will be capped at the USB 2.0 speed if you mix them. Finally, it’s important that your USB audio interface has its own dedicated USB port. ADK makes this easy, without purchasing an expensive hub.
  3. Third, you can connect directly to a TV or a 4K monitor using a standard HDMI cable. Dell includes a USB-C adapter with an HDMI port on it, but this isn’t ideal, because you may not always have it with your laptop.

You can connect 3 monitors to the ADP laptop and 4 monitors to the Dell laptop, but in reality you’ll need one or more of the Thunderbolt ports for your audio interface, so both laptops can have 3 external monitors.

Advantage Dell

Although I decided not to get a Dell, Dell has several clear advantages that should be mentioned.

  • More Portable – The Dell XPS is 1.18 pounds lighter (5.1 lbs. vs. 6.28 lbs.) and looks much thinner — even though the actual difference is only 0.34 inches (0.77 in. vs. 1.11 in.), which doesn’t seem like a lot to me, but for a student or businessperson who is carrying the laptop around all the time, the Dell would be more convenient.
  • Build quality – The Dell XPS looks great. The ADK laptop is more functional and would never be confused with a MacBook Pro.
  • More Thunderbolt Ports – The Dell XPS 17 has four Thunderbolt ports with DisplayPort and Power Delivery support (two on either side).

The Best Android Mobile Benchmarks

Although there is strong evidence that higher benchmark scores do not always translate into real-world performance gains, the best benchmarks do serve a purpose.  They are not subjective and can expose differences in hardware performance. Unfortunately, there are over fifty different mobile benchmarks to choose from, and picking the best ones is not easy. There are several reasons for this. Some benchmarks have serious problems and do not produce meaningful results. Other benchmarks haven’t been updated in years and should be taken down. A few benchmarks are bankrolled by companies with a long history of cheating. In the end, my research showed there are 4 or 5 benchmarks that really stand out and deserve a “Best” rating. A few others are very good, but not quite as good as the those with a “Best” rating. I found quite a few benchmarks that are good for certain things, so I placed them in their own category. Lastly, I found more than a few apps that have serious flaws and shouldn’t be used. Here are rankings of mobile benchmarks that will help you determine which to use, and which to avoid. This article is focused on Android benchmarks, but quite a few of these are available for iOS as well.

Capture1

Best

  • 3DMark (Sling Shot) One of the best GPU benchmarks. It incorporates volumetric lighting and particle illumination, as well as depth of field and bloom post-processing effects. Expect really low frame rates on the graphic tests. Although Sling Shot includes several good tests where physics including simulated worlds and particle systems are computed on the CPU, it isn’t the best benchmark for overall CPU performance. A useful graph is displayed after the test is complete, which plots the CPU frequency, temperature, frame rate for each of the tests. Scores vary depending on which of the modules you run. Even though the tests appear similar, scores from ES 3.1 mode should not be compared to scores from ES 3.0 mode. Requires Android 5.0 (or later).
  • GFXBench (formerly GL Benchmark) – This suite of 14 different tests is one of the best GPU benchmarks. Its “Car Chase” test was the first to test devices with hardware tessellation support. It also includes HDR tone mapping bloom, lens flares, particles, motion blur and more. Issue: Temperature and clock speed are not reported on devices like the Nexus 6.
  • PCMark for Android – This benchmark measures the performance and battery life of an Android device browsing the web, editing photos, watching videos and working with documents. Real applications are used, so the results are supposed to reflect real-world performance. The “Work battery life” test measures the time required to drain the battery in a device from full charge to 20%. This benchmark is useful, but isn’t a true test of processor efficiency, because the end result has a lot to do with the capacity of the battery in the device. Still, it’s one of the best battery tests.
  • Vellamo – One of the best mobile web benchmarks. Although it’s known for its HTML5 and Javascript browser performance tests, the Browser Chapter also includes SunSpider and Google’s Octane benchmark, as well as page load, text reflo, scrolling and crypto tests. Vellamo also has a good collection of multi-core benchmarks (Multicore chapter) which include Linpack, Sysbench and Threadbench. Lastly, Vellamo’s Metal chapter includes the Dhrystone and Linpack benchmarks, as well as storage and RAM memory tests. It should be mentioned that the person who created and maintains Vellamo is an employee of Qualcomm, although I’ve never seen any evidence Vellamo’s browser tests favor Snapdragon processors.

 Capture3

Very Good

  • Androbench – A good way to measure the storage performance on an Android device. Measures sequential reads/writes and random reads/writes.
  • Geekbench 4 – One of the better single-core CPU benchmarks. Geekbench also tests memory and multi-core performance. Geekbench 4 also includes new GPU compute tests, although it’s too soon to say how good these tests are. Requires Android 5.0 or later.
  • JetStream A relatively new JavaScript benchmark that is similar to Vellamo and PCMark’s Web Browsing test. Effectively replaces SunSpider and Octane because it includes SunSpider 1. 0.2 and Octane 2. Its makers claim it is better because “each benchmark measures a distinct workload, and no single optimization technique is sufficient to speed up all benchmarks.” Latency tests confirm that a web application can start quickly, ramp up to peak performance, and run smoothly without interruptions. Throughput tests measure the sustained peak performance of a web application. It’s supposed to be less easy to game because aggressive optimizations for one benchmark could make another benchmark slower.

Useful in Some Cases

  • 4GMark – A speed and quality of service benchmark for 2G/3G/4G cellular and Wi-Fi networks. After testing, you can compare your results against other users in your country, area, or the same device.
  • AndEBench-Pro 2015 – A suite of tests measuring CPU, GPU, memory and storage performance. It also gauges XML parsing, GUI rendering, image manipulation, data compression and cryptography tasks embedded in actual workloads. This benchmark is a product of EEMBC, which is led by Intel. This apps is based on AndEBench, which gets only 3 stars in Google Play. It was last updated in 2015 for Lollipop and is overdue for an update.
  • AnTuTu 6.0 – Better as a CPU test than a GPU test. AnTuTu is also not a good indicator of performance changes over time because its scores sometimes change dramatically as new versions are released. For example, bloggers benchmarking the Snapdragon 820 with AnTuTu 6.0 saw scores over 130,000. At the same event, on the same hardware, AnTuTu 5.7 reported scores around 70,000. That’s almost a 2x increase, which makes this benchmark very misleading. Although some of the best tech bloggers (e.g. AnandTech, Engadget and Ars Technica) no longer use AnTuTu, it’s still one the most popular Android benchmarks and the one that handset manufacturers like Samsung value the most. It also has more users than any other benchmark. For these reasons, I’m not moving it to the ‘Not Recommended’ section of this article – even though it probably deserves to be there.
  • Basemark ES 3.1 – Measures the OpenGL ES 3.1 graphics performance of your device. Also provides four results: Lighting, Compute, Instancing and Post-Processing. It’s part of their Basemark GPU Mobile test suite , which has a Pro version that reports FPS and other stats. I considered moving this to the “Good” section of this article, but after reading its mixed reviews and seeing that it doesn’t run on most mobile devices, I’m leaving it here for now.
  • DiscoMark – This little-known benchmark measures the launch-times of applications that you select. On the plus side, this test reflects the real-world performance of your phone. On the negative side, comparisons are meaningless, unless the same apps are selected.
  • Basemark GUI Free – Performs vertex streaming and blending performance measurements. Its vertex test is good, although the blend test is not great. It also hasn’t been updated since 2014.
  • Basemark X – A decent cross-platform graphics benchmark based on the Unity 4.2 game engine. This used to be one of the more demanding graphic benchmarks, but it hasn’t been updated since 2014, so it’s showing signs of age. Its off-screen test is also not completely resolution independent.
  • CF-Bench – A CPU and memory benchmark designed for multi-core devices. Although it produces a “final” score, its creators say you should take those with a grain of salt. Hasn’t been updated since 2013.
  • CompuBench RS – A RenderScript benchmark that tests compute performance of Android mobile devices. Still being updated, but not very popular.
  • Dhrystone– An older synthetic computing benchmark program which provides an indication of CPU “integer” performance. This benchmark isn’t a good indicator of performance but is still used by some chip manufacturers as a load to determine peak power consumption. Dhystone 2.1 is part of Vellamo’s Metal Chapter.
  • Epic Citadel isn’t a traditional benchmark, but it does have a “benchmark mode,” which reports an average frame rate after a game loop runs. I feel this app is useful because its graphics are representative of the real world games.
  • GameBench – GameBench is one of the more popular FPS testing apps. However it must run for for 10-15 minutes in order to get a frame rate reading, and there is evidence the results are not always accurate. I wrote an article that compares GameBench with others apps that report frame rates. GameBench is “App 2” in these tests. Note: This app also has privacy issues. It sends your email address, test scores and other personal data to the cloud where paid users can access it.
  • Google Octane– A good test of JavaScript performance in browsers.  This test is part of JetStream and the Vellamo Browser Chapter, so most users won’t need to run it.
  • Kraken– Yet another Java script benchmark. Still used by Ars Technica and some other bloggers.
  • SPECint 2006 – This benchmark is used by chip manufacturers and OEMs to measure CPU performance. It contains 12 different benchmark tests that stress a system’s processor and memory subsystem. The reason this benchmark doesn’t appear in the above sections is because it’s not available in Google Play and costs $800.
  • TabletMark – An automated tool that evaluates system performance on a range of activities, which include Web browsing, email, photo, video sharing and playback. Also includes a day-in-a-life battery test which includes idle time. While this benchmark sounds interesting, it’s worth mentioning that this app has less than 1000 downloads and a 3.6 star rating.
  • Trepn Profiler – This app isn’t a benchmark, but it reports accurate power readings and displays the processor frequencies as an overlay on any app. This is a good way to see whether your processor is throttling under a heavy load. When a processor is overworked and gets too hot, its frequency is reduced, which causes a drop in performance. The only reason this app is not in the “good” category is because newer mobile processors (including the Snapdragon 808, 810, 820 and 821) have a PMIC that only reports power readings every 30 seconds and this can affect the accuracy of average power readings. [Disclosure: I was involved in the creation of this product]

Not Recommended

  • 3DMark (Ice Storm) – Not the best test of advanced GPU performance. 3DMark Sling Shot has effectively replaced this test.
  • AnTuTu 4.0 – This app has heavy vertex shader complexity that is unlike real-world games. It also has no consideration for tiled rendering architectures.
  • AnTuTu 5.0 – This app’s 2D tests are not representative of the real-world games. This version was replaced by AnTuTu 6.0, which is better.
  • Basemark OS II – A system-level benchmark designed to measuring overall performance. In addition to its overall score, four different areas are also evaluated including system, memory, graphics, and web browsing. Not recommended because the rankings on this Powerboard web site aren’t credible and their free version is missing several features promoted on their product page. Battery Test and External Memory Tests are available in their Full version, but I can’t find a camera test anywhere. Also, this benchmark hasn’t been updated since 2014 and it is one of the lower-ranked popular benchmarks on Google Play (3.9 stars).
  • BenchmarkPi – One of several benchmarks that measures performance by calculating Pi. This benchmark isn’t recommended because it only tests the CPU and is no longer used by most bloggers. It also hasn’t been updated since 2009.
  • BenchmarkXPRT – A collection of different benchmarks. You won’t find the word “Intel” on the BenchmarkXPRT website, but if you check the small print on some Intel websites you’ll find they admit “Intel is a sponsor and member of the BenchmarkXPRT Development Community, and was the major developer of the XPRT family of benchmarks.” Intel also says “Software and workloads used in performance tests may have been optimized for performance only on Intel microprocessors.” Bottom line: Intel made these benchmarks to make Intel processors look good and other processors look bad. This benchmark should not be used.
  • BrowserMark – A cross-platform browser benchmark with issues that make cross-platform comparisons questionable.
  • CaffeineMark – A series of online tests that measure the speed of Java programs. CaffeineMark scores roughly correlate with the number of Java instructions executed per second, and are not supposed to depend on the amount of memory available or the speed of the Internet connection. Not recommended, because this test was created in 1997 for PCs and their Android app hasn’t been updated since 2011. Much better JavaScript benchmarks now exist.
  • CompuBench CL Mobile – Tests the compute performance of Android mobile devices supporting OpenCL. Tests include face detection, particle simulation, fractal rendering, ambient occlusion, raycast, gaussian blur and histogram normalization. Crashes on many devices. As a result it has a poor rating and cannot be installed on most devices.
  • Google V8 – Another browser benchmark focused on JavaScript performance. Was effectively replaced by Google Octane because it adds five tests on top of the ones already in V8.
  • Linpack – Measures the floating point performance of the CPU. Linpack is part of the Vellamo’s Multicore and Metal tests, so it’s not really needed. It’s also no longer used by most bloggers who benchmark and hasn’t been updated since 2011.
  • MobileXPRT – You won’t find the word “Intel” on the BenchmarkXPRT website, but if you check the small print on some Intel websites you’ll find they admit “Intel is a sponsor and member of the BenchmarkXPRT Development Community, and was the major developer of the XPRT family of benchmarks.” Intel also says “Software and workloads used in performance tests may have been optimized for performance only on Intel microprocessors.” Bottom line: Intel made these benchmarks to make Intel processors look good and other processors look bad. MobileXPRT should not be used.
  • Nenamark 1 – An OpenGL ES 2.0 graphic benchmark that is meaningless, because all modern devices hit its 60fps framerate limit. Hasn’t been updated since 2011.
  • Nenamark 2 – An OpenGL ES 2.0 graphic benchmark that is supposed to have more advanced effects and higher resolution graphics than NenaMark1. Hasn’t been updated since 2012.
  • Nenamark 3 – Another OpenGL ES benchmark that is supposed to continuously grow more complex until the system cannot handle it any more. However, it doesn’t allow you to change the resolution, so a phone with a very high-resolution screen is likely to perform worse than a budget phone with a low-resolution screen. This is also why it favors iPhone over Android flagships like the Nexus 6P.
  • Passmark – Tests CPU, storage, 2D graphics, 3D graphics, storage and memory performance. Hasn’t been updated since 2013.
  • Pi – Calculates how long it takes to calculate Pi up to 10 million digits. Not a useful benchmark because it only measures one thing.
  • Quadrant Standard Edition – Mostly a CPU benchmark, although it also claims to test CPU, memory, I/O and graphics. Hasn’t been updated since 2012.
  • Smartbench – A multi-core-friendly benchmark that measures overall performance. Tests productivity and gaming. Last updated in 2012. Poorly rated on Google Play (3.8 stars).
  • SunSpider – The JavaScript benchmark SunSpider is no longer being updated. Its creators recommend JetStream. Even when it was still popular, the data that SunSpider used was so small that it was more of a cache test than a JavaScript benchmark.
  • WebXPRT– You won’t find the word “Intel” on the BenchmarkXPRT website, but if you check the small print on some Intel websites you’ll find they admit “Intel is a sponsor and member of the BenchmarkXPRT Development Community, and was the major developer of the XPRT family of benchmarks.” Intel also says “Software and workloads used in performance tests may have been optimized for performance only on Intel microprocessors.” Bottom line: Intel made these benchmarks to make Intel processors look good and others look bad. WebXPRT should not be used.

I hope you find this article to be of use. If you have any comments please enter them below.

– Rick

Copyright 2016 Rick Schwartz. All rights reserved. Linking to this article is encouraged. All of the comments in this blog are Rick’s alone, and do not reflect the views of his employer.

The Smart Home Has Finally Come of Age

1

Almost 15 years ago I attempted to convert our house into a smart home. Back then many smart devices were controlled using the X-10 protocol, which communicated over power lines. It was cool when it worked, but it was far from reliable. Fortunately the connected home has come a long way since then. Here’s why I believe the smart home is now ready for prime time:

Why Smart Devices Have Come of Age

  • Voice-activated – Smart controllers like Amazon’s Echo control thermostats, light bulbs and smart hubs using your voice. Voice-activated controllers are easy to use because they respond to natural language commands like “Alexa, turn off the family room light.”
  • Better reliability – Many smart devices are now controlled using ZigBee or Z-Wave. These newer smart home protocols have many advantages over the earlier home automation protocols like X-10. First, they don’t communicate over power lines, so they are much more reliable. Products like light switches and outlets act as signal repeaters, so they extend the range of your network. Second, they communicate over a mesh network, so any smart device can talk to any other smart device. Finally, some of these new protocols don’t use the same frequencies as Wi-Fi products, so they are much less susceptible to wireless interference.
  • Interoperability – Smart hubs like Samsung’s Smart Things work with Wi-Fi, ZigBee, Z-Wave and cloud-connected products like Amazon’s Echo. In fact, over 1,000 different products work with SmartThings today, so you won’t hard a hard time finding compatible products. Although SmartThings is a Samsung product, it works with iPhone as well. In the future, the SmartThings hub is supposed to work with the Thread home automation protocol, which Google and others are using, as well as Bluetooth, which Apple’s HomeKit uses.

3.PNG

  • Easy to install – The first smart home devices were connected using wires. Now, many devices are wireless. To add a motion sensor, you just stick it to the wall using adhesive tape. If you decide to move it later, you can do so without leaving any holes in your wall. These smart devices are battery-powered, so they don’t need an AC adapter, or connection to wall power. They even report their battery level to the smart hub, so you’ll know when it is time to purchase a new battery. In case you are wondering, batteries last about a year.
  • No security keypads or loud alarms – Today’s smart home can be programmed to automatically arm itself after every family member has left. Only then will you be notified when there is motion. There’s no need for a loud alarm that annoy your neighbors. You’ll receive a text that tells you what triggered the alarm (e.g. smoke, fire, motion or a water leak). If you have cameras installed, you’ll see what caused the motion. When the first family member returns home, the alarm will be automatically turned off, without the need to enter a long security code. And the best part is, you get all of these services and more without a monthly fee.
  • Mass appeal – Smart home products are no longer just for nerds. Nest thermostats, Dropcam and Amazon’s Echo are all extremely popular. Over 100,000 Nest thermostats are sold every month. Over 3 million Amazon Echos have been sold to date. These companies have also done a good job explaining how these devices work with other smart home devices, so they have effectively primed the pump for other smart home products. Once Apple’s HomeKit catches on, and Google comes out with their smart hub, millions of additional consumers are likely to create their own smart homes.
  • Smart devices do more – Samsung’s multi-sensor can detect contact open and closed status, movement, vibration, and orientation (vertical or horizontal). Smart outlets measure energy usage and act as signal repeaters. Some smart thermostats also detect motion, so they can automatically turn off your air conditioning when you are away. Some wireless smart devices also report temperature, so they could detect a fire in an area of your home that does not have a smoke detector.
  • Better software and services – The first smart hubs only worked with software from a single company. Today’s smart hubs and controllers work with apps, plug-ins and services from a wide range of different developers. Apps are available that do a wide range of things. If you can’t find an app that does what you want, you can create your own, or modify existing apps. The best part is that you do not have to an experienced programmer to do this. Amazon Echo users can use a wide range of plug-ins called Skills and services including Pandora, Spotify, iHeartRadio TuneIn, Audible, Amazon Music and Prime Music.

4c

Things a Smart Home Can Do for You


There is almost no limit what is possible in today’s smart home. Here are just a few examples of the things you can do:

  • Have your air conditioner automatically turn up it’s thermostat so it doesn’t run after all of cars used by your family have left your neighborhood
  • Setup your Sonos to play the sound of a loud dog barking when there is motion and you’re not home
  • Have your Jawbone to automatically open your window blinds and disable your alarm when you get up in the morning
  • Recieve a text after your mail has arrived
  • Use your phone to start a “Good morning” mode that adjusts thermostat, turns on a coffee maker and starts your favorite music playlist, or a “Goodbye” mode, that opens your garage door, turns up the thermostat, turn off all of your lights and locks your doors
  • Get a notification on your BMW dashboard if there is an intruder, fire or water leak in your home
  • Use a sensor to monitor the moisture in your soil and only turn on sprinklers when needed
  • Use your iPhone or Android smartphone to control any smart device in your home. Have you ever left your home and realized that you forget to turn something off? You can now address issues like this using your phone – no matter where you are.
  • Make a voice call on an Ooma Telo using an Amazon Echo
  • Turn on a ceiling fan after the temperature rises above 78 degrees
  • Change the color of your lighting based on different events. For example:
    • If there’s a water leak, turn my lights blue
    • If there’s a smoke alarm, turn my lights red
    • If there’s a fire, turn on all of the lights in my home
  • Record 10 seconds of video prior to the start of an event, so you can see what triggered an alarm. For example, if someone were to kick in your front door, you’d see the door fly open and the face of the person as they entered, not just the back of their head

And last, but not least, a smart home will save you money. Nest Labs released a white paper last year, which showed a smart thermostat saves its owner 10-12% on heating and a 15% on cooling. That’s a savings of up to $145 a year. ecobee claims an average savings of 23%. If you live in Southern California you can get two $150 ecobee thermostats for free if you agree to raise your thermostat on peak usage days. You’ll save even more if you have your lights automatically turn off when you exit a room. I could go on, but you get the idea. If you can dream it, you can probably do it.

How to Get Started


2
Start by buying a smart hub. The hub is the brain of your smart home, connecting you and your devices via apps on your phone, tablet or computer. Once you select a hub, you can start buying smart devices. I started with an Amazon Echo. Then I bought a smart hub and two motion controllers for $180. Discount coupons and sales are common. There are also money-saving bundles available that include a smart hub, motion sensor, two multipurpose sensors (that monitor whether doors, windows, or your garage are open or closed) and an outlet to control lights, or small appliances. Here are some tips how to make your smart home more reliable:

  • Locate your hub wisely – It’s tempting to put your smart hub next to your Wi-Fi router, but that’s not the best place for it. Locate it in a central location that is not too close to your router and other wireless devices.
  • Watch for interference – Because ZigBee devices share the same 2.4 GHz band as Wi-Fi products, they could have problems with interference. When possible, have your smartphone, laptop and media streamers to use the 5 GHz band to eliminate wireless interference. If you must use the 2.4 GHz band, use a mobile app like this one to change to a less congested Wi-Fi channel. Sonos products can also interfere with ZigBee devices. Z-Wave devices are more reliable because they use a less congested wireless band.
  • Create a device map – It’s a good idea to draw a simple map of your connected home and the estimate the distance of each device from the smart hub or the closest device with the same protocol.

      11.PNG

    • Pay attention to the distance between your smart hub and ZigBee devices, because their maximum range is 35 feet. Every time ZigBee or Z-Wave signals go through a wall, their range drops. Z-Wave has a maximum range of 100 feet however, if you have metal junction boxes and dense walls, the range can drop to only 17 feet. Try to arrange devices and repeaters to have line-of-sight communication with each other, or at most one wall (or floor) between them.
    • Color code Z-Wave and ZigBee devices differently on your map, because ZigBee devices can only communicate with other ZigBee devices and Z-Wave devices can only communicate with other Z-Wave devices.
    • Circle all devices that act as repeaters. Keep in mind that battery-powered devices cannot act as repeaters.
    • Techie tip: Rotating your smart hub can solve signal problems. Try to determine which direction your antennas radiate and position the hub so it doesn’t radiate away from your devices.
  • Use repeaters to extend your range – Z-Wave and ZigBee device utilize mesh networking, which allows signals to “hop” through other devices to reach the destination device. However, both have range restrictions (as discussed above). Add a repeater if some of your smart devices don’t respond reliably. Keep in mind that a ZigBee repeater won’t extend the range of a Z-Wave device.
  • Tune-up your network – As you add smart devices, the topology of your network changes. There are several things you can do to improve the communication between your smart devices and hub:

    • Z-Wave devices do not automatically look for new “parents.” Once a device picks a parent, it will hold on to it until it cannot talk to it any more, even if a different parent is added to the network that would be a better choice. To make sure your Z-Wave devices are routing optimally, look for a “Repair Z-Wave Network” command in the software for your hub.
    • You can force a ZigBee device to pair with a better parent by turning off your hub, and leaving it off for up to 10 minutes so the device loses communication with its former parent (the hub). After you turn back on the power to your hub, your ZigBee devices will find better parents (if they exist).

The Last Word

The smart home has come a long way. The best smart home hubs support multiple connected home protocols so you can choose from a wide range of devices. Interoperability between products is good and there is a wide range of products available including motion sensors, presence sensors, moisture sensors, door locks, electrical outlets, voice activated controllers, smoke detectors, smart light bulbs, garage door openers, vents, sprinklers, blinds, speakers, thermostats and much more. Smart devices communicate over a mesh network, which improves as you add more devices and connected to the cloud so you can monitor and control your smart home anywhere in the world. It’s time for you to think about automating your home. Start simple and add products over time. There are many good videos online that will help you get started. Have fun!

2.PNG

Copyright 2016 Rick Schwartz. All rights reserved. Linking to this article is encouraged. All of the comments in this blog are Rick’s alone, and do not reflect the views of his employer.

How to use less than 100MB of mobile data each month

I recently switched carriers from Verizon to Google’s Project Fi. Google only charges you for the data you use, so it is in your best interest to use as little as possible. I used to use 3GB or 4GB of data each month. Now I use less than 100MB of data every month. You read that right. I reduced my data usage by 40x. Read on to learn how to do it and still use your phone every time you need it.

  1. 1
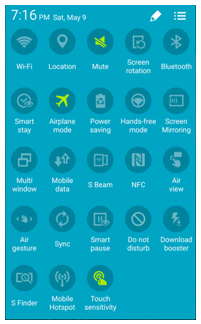
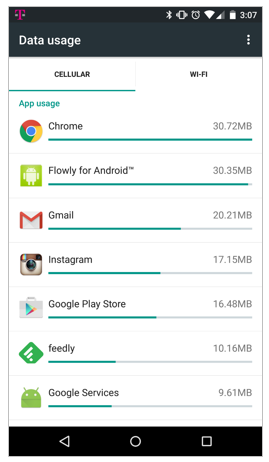
Turn off cellular data when you don’t need it– Some apps use cellular data when Wi-Fi is available. Almost all apps use data in the background when you are not using them. I found that I had apps that I never used that wasted large amounts of data. Over an entire month, this really adds up and eats into your monthly data plan. Even with cellular data off, you’ll still be able to make calls and send or receive texts over the cellular network.
  2. Monitor your data usage and uninstall problem apps– It’s essential that you go to Settings and review your cellular data usage. Be aware which apps use the most amount of mobile data. Social media, news and weather apps are notorious for syncing often – even if you rarely use them. If you uninstall Facebook, Snapchat and popular news and weather apps, you’ll be surprised how much data and battery life you save. You can still access Facebook using your mobile browser whenever you want to. News and weather sites can be accessed via browser as well. You can even bookmark them so they appear on your home screen like an app. Try to only use apps like Instagram and web browsers over Wi-Fi, because they use lots of data.
  1. Restrict background data usage– It’s highly recommended that you go to Settings > Data usage and view the app background data for your apps. I’ve enabled ‘Restrict app background data’ on all apps and haven’t had any problems. When you do this, a warning will appear, but you can ignore it. I’ve been doing this for almost a year without any problems whatsoever. I was surprised to find that apps I never use consumed a lot of background data. There is a global setting to restrict background data, but I recommend you do this on a per app basis, so you can enable any apps that have a problem in the future.

Restrict2

  1. Only update apps on Wi-Fi – Make sure you go to Settings in the Play Store app and go to ‘Auto-update apps’ and set it to ‘Do no auto-update apps’ or to ‘Auto-update apps over Wi-Fi only.’ This will save you large amounts of data.
  1. Avoid streaming over mobile – Streaming audio or video uses much more data than text. Download your favorite songs and playlists so you can listen to them offline. Avoid streaming video from sites like YouTube or Netflix over mobile because this can consume extremely large amounts of data. Consider switching to a carrier like T-Mobile with their binge-onplan, which lets you stream endless amounts of music or video without eating into your data plan.
  1. Never use maps with cellular enabled – Google Maps consumes huge amounts of data when you use it for driving directions. Most people don’t know that you can use turn-by-turn driving directions without using any mobile data if you load your directions while you are connected to Wi-Fi. If it ever says “Lost data connection” turn on cellular data for a few seconds and it will fix the problem. Then turn it back off. You can do this with the quick settings menu, so it doesn’t distract you from driving. Better yet, do this when you are waiting for a stop light to change. You can also cache maps before you leave or select a region on a map and have it work offline, but I find that to be unnecessary.
  1. Use Wi-Fi whenever it’s available– Almost everyone has Wi-Fi access at home and work so the only time you should turn on mobile data is when you are on-the-go and out of range of Wi-Fi. Free public hotspots are common and there are apps that will help you find them. Most broadband providers provide access to free Wi-Fi hotspots as well. Another tip is to go to your favorite sites before you leave home in the morning. I sync my email, news app, Twitter and RSS feed apps before I leave the house. This saves me over 100MB a day.

2

  1. Change your sync settings – You might want to try disabling ‘Auto-sync data’ by going to Settings > Accounts > Google and touching the 3 dots in the upper right. When you are connected to Wi-Fi, you can manually sync all of your Google accounts at any time by going to Settings > Accounts > Google and touching the 3 dots in the upper right and selecting ‘Sync now.’ You can also reduce data consumption by adjusting your Inbox to check for mail less often. I have mine set to ‘Never’ and I still receive notifications when new mail comes in. This change is made in the mail app and not on the Settings pages.
  1. Know your daily data budget – If you want to consume less than 1GB of data a month, you need to keep your average data usage under 33MB a day. If you consume 60MB in a single day, don’t worry. It won’t be a problem as long as consume less than 32MB on a few other days. I try to use an average of 3.33MB a day, so I stay under 100MB. It’s not hard to do because I often go days without using any mobile data. If you suspect an app is using too much data, download software like App Tune-up Kitand use it to select the app you want to test. It will run for one minute and measure the amount of mobile data used by the app. [Disclosure: I was on the team that created this app.] Most popular games use large amounts of mobile data. You should only play these apps when you are connected to Wi-Fi.
  1. Avoid apps with ads – Apps with ads consume more mobile data than apps without ads. If the apps you use have ad-free versions available, purchase them. Spending a few bucks will save you money in the long run.

data with title 2

  1. Use other people’s data – If you have a friend or family member with unlimited data, ask if you can tether and share their data. If you’re phone doesn’t support this feature free of charge, there are apps in Google Play like FoxFi that do this very well. Make sure they work with your phone and carrier before buying them. They generally have a trail version.

Using mobile data consumes over twice as much power as Wi-Fi data, so following the above steps won’t just save money, you’ll also extend your battery life. I ended up reducing my monthly phone bill from over $70 to about $23 a month. That’s a savings of around 60%.  Check to see if your carrier offers discounts if you change your plan to one that uses less data. If they don’t consider switching to a carrier who does. The savings add up quickly. In five years, I’ll save $2400.

You don’t have to follow all of the above steps to save data. Even if you only try a few of these suggestions, you could cut your mobile data usage in half. The more steps you follow, the more you’ll save.

– Rick

Copyright 2016 Rick Schwartz. All rights reserved. Linking to this article is encouraged. All of the comments in this blog are mine alone, and do not necessarily reflect the views of my employer.

Follow me on Twitter @mostlytech1

How to Power Profile A Mobile App Using Hardware

This article is the second in a series for mobile software developers. The first article can be found here. It is intended to help developers create apps with better battery life. This article will focus on Best Practices for hardware power measurement. This is something every developer should care about because reducing power consumption results in longer battery life and happier users.

Battery life is now the number one thing consumers care about. Developers need to take action to ensure their app doesn’t not consume too much power, but most of them have no idea how much power there app consumes. You could use software like GameBench or Trepn Profiler to measure power consumption, but those run on your device. Collecting large amounts of power data and storing it locally consumes CPU cycles, which can inflate power readings. Another problem is the fact that popular devices from Samsung don’t report accurate direct power readings. With these devices, you need to measure power using an off-target hardware-based solution. This article shows you how it’s done.

Monsoon

Good Power Meters Aren’t Cheap

There are different ways to measure the power consumed by mobile devices, but the most popular off-target method is using a Monsoon Power Monitor. This $771 device effectively replaces the battery on your phone. It can measure the voltage, current and power and connects to special PC software which provides control over power data is collected and displayed. After your Monsoon arrives, you need to download this software and documentation from their website. You also need bypass the battery in your phone, so the Monsoon can power it. Although you could connect two banana to mini-grabber cables directly to your phone, the battery gauge and temperature monitoring won’t work unless you leave the battery in and use insulated copper tape as described in the Monsoon manual. Their user guide describes how to prepare your phone so it can be connected to a Monsoon Power Monitor. Once you’ve modified your battery, you’ll need to determine how you are going to charge it. In most cases you’ll just fold back the copper tape on the plus terminal so that battery charges normally. If you have a phone like a Nexus 6, which doesn’t have a removable battery, you got a challenge on your hands. Checkout the Appendix at the end of this article to see why.

It easy to measure power on a phone with a removable battery

It easy to measure power on a phone with a removable battery

Connecting Your Device

Now that you’ve modified your battery, you’re ready to connect your phone to the Monsoon. If you haven’t done so already, download and install the Monsoon software and connect a USB cable to the of the power monitor, so you can install the drivers as described in the manual. Before connecting your phone to the Monsoon you need to perform one final test. Connect your modified battery to the red and black banana plugs on the front on the Monsoon. Make sure the Monsoon is off and press the power button on your phone. If the phone powers up, the connection to the battery has not been broken. Now launch the ‘Power Tool’ software on your PC and turn on the Monsoon. The LED on the front panel of the Monsoon should be green. Press the ‘Refresh’ button and highlight your device on the PC software and click on the Select button. If the software can’t communicate with the Monsoon, power cycle the Power Monitor.Capture3By default, the power supply on the Monsoon is turned off, so you’ll need to turn it on and set the proper voltage. Click on ‘Set Vout’ and enter the proper value for your device. Next, enable ‘Vout,’ and enter the size of your battery. Once you confirm VOUT is enabled on the software, you can power up your phone. Wait until the Android home screen is displayed until you proceed. Next, connect a cable from the USB out on the front of the Monsoon to your device. This will be used to control your device remotely. When USB passthrough mode is set to AUTO, once sampling is started, the direct USB connection is disabled, charging over USB is disabled and samples are measured without the interference of USB charging. As soon as sampling is stopped, the direct USB connection is re-enabled and data can once again be transferred to and from the device over USB

Sizing Up Your App

You should perform a series of tests with your app, and similar apps, so you know how your app compares to the competition. You should measure idle power consumption, average power consumption and peak power consumption. You’ll find step-by-step directions below how to do this.

Measuring Idle Power Consumption

Measuring the power consumed when an app is doing nothing and comparing it to the idle power consumption of your device can show if the app under test is keeping the screen or processor awake. It can also identify problems with analytics and ads. Start by measuring the baseline idle power consumption of your device without any apps running. Since the screen is such a large consumer of power, you should measure idle power with the screen off as well as on and carefully document the screen brightness level. The chart below shows how much power an idle Nexus 6 consumes at various screen brightness levels. Brightness levels are set via ADB script — not using the Android OS slider.

Power consumed by a Nexus 6 at various brightness levels

Power consumed by a Nexus 6 at various brightness levels

Preparing to measure power

    1. Connect your mobile device to the Monsoon Power Monitor.
    2. Launch the Monsoon PowerTool software on your PC and enable Vout as described above.
    3. Power up your smartphone or tablet and wait 5-6 minutes.
    4. Check ‘Power Avg’ on the Monsoon and set the units to mW (100 units/tick).
    5. Turn off all unneeded features like Wi-Fi and Sync and put your device in ‘Airplane Mode.’
    6. Go to Settings and launch the Application Manager. Stop all unneeded apps and services under the ‘Running’ heading.

A full list of Best Practices for the Monsoon is posted at the bottom of this article.

Measuring the idle power of your device and software
Monsoon1

  1. Press the RUN button to start recording power consumption.
  2. Don’t touch your device for at least 60 seconds.
  3. Press the STOP button when you are finished recording and select the on-screen region you want to use for your average. It’s a good idea to record average power readings with and without spikes. To filter out spikes and get a more accurate average, select a region on the Monsoon software without any large spikes (as shown on the right). This should only be done for idle power measurements when you believe the spikes are caused by other apps or the operating system.

Here are some idle power measurements taken on a Samsung Galaxy Note 3 with no apps running in the foreground.

    • Average idle power – screen off – 15.6 mW (without spikes)
    • Average idle power – screen off – 27.8 mW (with spikes)
    • Average idle power – screen brightness min. – 391 mW (without spikes)
    • Average idle power – screen brightness min. – 410 mW (with spikes)
    • Average idle power – screen 50% – 528 mW (without spikes)
    • Average idle power – screen 50% – 557 mW (with spikes)
    • Average idle power – screen 100% – 870 mW (without spikes)
    • Average idle power – screen 100% – 882 mW (with spikes)

For comparison purposes, here are a few idle power readings for a Nexus 6 with no apps running in the foreground. The Nexus 6 has a larger screen with considerably more pixels (2560×1440 vs. 1920×1080). This probably accounts for most of the difference in power consumption between these two devices.

  • Average idle power – screen off – 20 mW (without spikes)
  • Average idle power – screen 50% to 100% – 660mW to 1200 mW (including spikes)
  1. After you finish measuring the idle power of your device, launch your app and measure the idle power when it is running. In theory this should be similar to the idle power of the device, but often it’s higher. By comparing the idle power of your app with similar apps, you can determine if your app has a problem.

Here are some idle power measurements taken on a Samsung Galaxy Note 3 before playing two different games:

  • Average power No app running (idle) – 557 mW
  • Average power Temple Run (idle) – 1575 mW (during the first minute while screen awake)
  • Average power Temple Run (idle) – 720 mW (after the screen dims about 60 seconds into the test)
  • Average power Asphalt 8: Airborne (idle) – 2139 mW

Test Details: Duration: 2:00 Screen brightness: 50%; Airplane Mode: On; Wi-Fi enabled (Asphalt 8 – Won’t run without Wi-Fi); All readings above include power spikes.

There are several reasons why Asphalt 8 consumes 36% more power than Temple Run during the first minute of testing. Asphalt 8 has nice visual effects and sound and Temple Run does not. However, when you let the test run for two minutes, Asphalt 8 consumes 197% more power. The biggest reason for the discrepancy is because Asphalt 8 holds a full wakelock, which never lets the screen go to sleep, while Temple Run lets the screen dim after the user defined interval. In my test, this was set to 60 seconds.

Measuring Average Power Consumption

Here are some average power measurements taken on a Samsung Galaxy Note 3 with the same games tested above:

  • Average power Temple Run (in-use) – 1629 mW
  • Average power Asphalt 8: Airborne – [TBD] mW

Test Details: Screen brightness: 50%; Airplane Mode: On; Wi-Fi enabled; All readings above include power spikes.

Measuring Peak Power Consumption

Before measuring the peak power that your software consumes you may want to measure the peak power of one or more popular benchmarks since that will establish a top limit of the power which can be consumed by your device.

Here are some peak power readings taken on the Samsung Galaxy Note 3 for some popular benchmarks:

  • AnTuTu Benchmark v5.7 – Max. power – 9761 mW
  • AnTuTu System Stability Test – Max. power – 9855 mW
  • GFXBench 3.0 – Max. power – 10497 mW (graph shown below)

Test Details: Device: Samsung Galaxy Note 3; Airplane mode: On (except for GFXBench); Wi-Fi: Off; Screen Brightness: 100%; Bluetooth: Off; Sync: Off

benchmark

Power Measurement is Fun

Having a better understanding of mobile power consumption will help you to make more power efficient apps. ThemesThe thought is, if you can measure it, you can act on it. You can make changes to your code and see what the affect is. You can see how your app compares to the competition. You can also answer power-related questions like the following:

Q: Do dark themes really save power?
A: Yes. The average power consumed by the Google News & Weather app with a light theme selected is 893 mW. With a dark theme selected, only 410 mW of power is consumed. That’s a savings of 54%!
theme charts
Test Details: Device: Samsung Galaxy Note 3 with AMOLED display; Airplane mode – On; Wi-Fi: Off; Brightness level – 50% according to slider; Screen mode – Standard; Auto-adjust screen tone – Disabled

Q: Should my app wait to perform certain tasks until a user is on a Wi-Fi network?

A: The answer to this question depends in part on the type of app and the signal strength of your networks. If your app transfers large amounts of data, you should wait until the user connects to Wi-Fi when possible. In the test below I download a 100MB file from a website. Over Wi-Fi the average power consumption was 997 mW and the download took about 65 seconds. Over 4G, the average power consumption was 2291 mW and the download took about 195 seconds. Bottom line: Transmitting large amounts of data over a 4G cellular radio can use over twice as much power. One reason for the high cellular power consumption in my test may be related to signal strength, which only showed 2-bars. Under conditions like that, the phone has to amplify the signal more.

Well-designed apps only download files when the user is connected to Wi-Fi, but give the user the ability override this setting if desired. This is a good approach to follow. Google has code snippets online that show how this can be done.

LTE2

Monsoon Tips & Tricks

The Monsoon User Guide is very long, but doesn’t include any tips how to get the most out of it. As a result, I’ve included some suggestions here:
Cursors

    • To quickly identify minimum and maximum power readings, use cursors as shown on the right. You can also export the results of a profiling session as a CSV file. However, this isn’t ideal, because it takes a long time to export this data and Excel often fails to import all of it. If you do go this route for shorter profiling sessions, use the Statistical MIN and MAX formulas under the Formulas tab/More Functions.


  • If you get a message saying the Monsoon isn’t communicating with your computer, or you can’t start or stop profiling, try power cycling the Monsoon hardware first. If that doesn’t work, reboot your computer.


  • Immediately after starting the Monsoon software, sometimes accurate readings aren’t displayed. Pressing the ‘Run’ button seems to help fix this problem.


Range


  • It’s a good idea to use your mouse to set the range of data you wish used to compute the average (as shown on the on the right). This allows you to disregard data at the beginning or end of a profiling session for more accurate readings.


  • You may see the calibration status indicator on the Monsoon software go yellow or red for a few seconds. According to Monsoon support, this doesn’t necessarily mean anything is wrong. If it stays in this state for longer periods, you should investigate.


  • If your power peaks are off-screen, change the units from mW to W.


  • You can turn on any of the available graphs at any time – even if they weren’t enabled when you captured your power data. This is helpful if you want to see the relationship of average power to peak power, or compare maximum power and current readings.


  • Under very heavy loads, you might notice the voltage on the Monsoon hardware drops slightly.


  • The Monsoon software drivers appear to have some stability issues and can cause blue screen crashes. As a result, I recommend you don’t leave it connected to your PC’s USB jack when you are not using it.


  • Make sure to use the offset feature to on power and current values to make your results more clear.


Hardware Power Measurement Best Practices

Here are some best practices you should follow if you want the most accurate power measurements:
QuickSettings

    • Your screen is the single biggest consumer of power and can skew your readings if you don’t consider the following: Make sure the screen brightness does not change between tests. Do not enable ‘Auto’ brightness. Also, turn down your screen brightness to the lowest possible level when taking power measurements. When possible, turn off the screen entirely.


  • Go to Settings and select the Application manager. Swipe to the left until you can see the list of running apps. Close all unneeded apps and stop all unneeded services.


  • Turn off all unneeded features including Wi-Fi, Mobile data, Bluetooth, Location, NFC, Sync, Download booster, etc. Most phones let you do this by swiping down to access a Quick Settings screen like the one shown on the right. Notice how almost everything is turned off. You may want to also turn off all syncing options under Settings > Accounts > Google.


  • Most popular apps have analytics that send data to the cloud periodically. To prevent this for occurring, turn on ‘Airplane Mode,’ and turn off Wi-Fi if your app doesn’t need to communicate with the cloud. This will also prevent apps from automatically downloading updates in the background.


AppsRunning


  • If you’re serious about power profiling, consider purchasing a Nexus phone or tablet and only install a minimal number of apps on it. Having lots of apps running in the background affects the accuracy of power measurements. My LTE-enabled Nexus 7 only has 3 apps running on it, while my Verizon Galaxy Note 3, still has 22 or more apps running in the background — after I’ve closed all apps and stopped all unneeded processes.


  • If you are purchasing a new device for power modelling, choose a device with a removable battery that you can easily access with and contacts that you can clip on to.


  • Time your tests. Make sure each test is at least a minute. Longer runs minimize the impact of power spikes on averages.


  • Run each test at least two or three times and average the results. Throw out any values that are noticeably higher than the rest and retest. Even with Airplane mode on and Wi-Fi off, the OS and apps on your device still work in the background. This causes power spikes that can affect the accuracy of your readings. If you have a rooted device, consider using software like RepetiTouch to record your keystrokes. This will ensure your test runs are the same each time.


  • Consider uninstalling apps that relaunch after you close them like Microsoft’s ‘One Drive’ or Nokia’s ‘Here.’


  • Do not setup your device for use with multiple users because that makes it harder to close all of the background apps.


  • Turn off ‘Google Now’ as follows: Turn off “Ok Google” Detection by going to Settings > Accounts > Google > Search > Voice. Select “Ok Google” detection and turn off ‘From the Google app’ and ‘From any screen.’ Turn off ‘Show cards’ under Settings > Accounts > Google > Search > ‘Now cards.’


  • Pause or disable step counters like ‘S Health’ or ‘Google Fit.’ These apps can consume significant CPU cycles while your device is idle.


  • Avoid using your power measurement device with a wearable. Wearables require that Bluetooth is active and have cause multiple apps to run in the background.


  • Make sure your computer doesn’t go to sleep when you are capturing data. If it does, you could lose data. To do so, make sure your PC is charging via AC adapter and not running on battery. Set your power profile so your hard disk goes to sleep after 30 minutes. Set your processor and screen so it never goes to sleep when connected to a power source. Turn off your screen saver. Move your mouse from time to time to let the computer know you are still using it.


  • It’s normal for your phone to do housekeeping after it start up. Wait 5 or 6 minutes after powering up your mobile device before profiling it. I’ve seen power spikes over 8 watts after the Android home screen is visible and the boot up process appears to be complete. Power consumption over 6 watts for 30 seconds or longer isn’t unusual. Sometimes these high power readings are related to app updates, but I’ve also seen this occur in ‘Airplane Mode,’ with Wi-Fi off. These spikes will inflate your power measurements and often have no relation to the activity you are attempting to measure.


Spikes

Appendix – Preparing a Nexus 6 for Power Monitoring

Phones like the Nexus 6 do not have a replaceable batteries. This makes it very challenging to connect power measurement tools like a Monsoon to them. First, you’ll have to get special tools to remove the back of your phone. The iFixit website shows you how to remove the back cover and get access to its battery. You’ll need a special Torx screwdriver to get access the battery of the Nexus 6. Before you order that screwdriver and remove the 22 screws, you should read the next two sections. It could save you some time.

Nexus 6 screws
Sadly after almost completely disassembling my phone, I learned that the battery in the Nexus 6 does not have metal pads like a most cell phones. doorIt has a flex cable that connects to a small 4-pin jack that can be seen under a hidden door (shown on the right). After learning about the special power connector in the Nexus 6, I contacted Monsoon support thinking they must sell a cable assembly for this popular developer device. The Monsoon support rep said they didn’t know how to connect a Monsoon to the Nexus 6, so I referred to their manual, which shows how to create a battery bypass, using flat copper foil and special insulating tape. It’s important that you bypass the battery in your phone, so the Monsoon can power the device. However, the battery needs to remain in place for thermal monitoring and use by the battery fuel gauge. Now that the battery has been bypassed, you’ll need to determine how you are going to charge it. More about that later. I first tried to connect insulated copper tape to the same pads that are used for wireless charging on the Nexus 6, but for some reason that didn’t take the battery out of the circuit. Out of frustration, I took the device to my company’s proto lab for assistance.Wires modThey determined which of the wires on the 4-pin connector were the + and – and broke the connection to the positive wire, so the battery would no longer be in the circuit. You can see their mod on the left. The black wire is attached to a small pad on the Nexus circuit board that is connected to the minus terminal of the battery. The red wire is connected to the + power input on the circuit board. The red wire is connected to a trace that was previously connected to the + side of the battery, but that trace was cut to break the connection, so the Monsoon can power the phone. The gray wire is attached to a pad that connects to the + battery terminal. By mating the red and white banana plugs (as shown on the right), the connection to battery is restored, so it can be charged normally over USB.

Before You Begin

This section isn’t intended to be a how-to. It’s intended to discourage most developers from attempting a mod like this. Before you disassemble your expensive Nexus 6, you need to make sure that you are willing to take the risks described here. If you haven’t done circuit board modifications before, or don’t have all of the proper equipment, don’t attempt this. Your chances of success are poor. I think you’d be better off using a phone with a removable battery like a Samsung Galaxy Note 3 or Galaxy Note 4 for power measurement. You should be able to purchase those for $99 to $299, and they are much easier to connect to a Monsoon Power Monitor. In fact, in a pinch you can connect two banana to mini-grabber cables to a Note 3 without any modifying your phone or battery. It works fine, but the battery gauge won’t work unless you leave the battery in and use insulated copper tape as described in the Monsoon User Guide. If you want a to power model a Nexus phone, keep in mind that the Nexus 4, Nexus 5 and Nexus 6 report accurate battery power using Trepn Profiler, or other software, so you don’t even need a Monsoon. If you decide to try this mod despite my warnings, you are on your own. I cannot answer any questions about this, nor can I be responsible if you damage your device.

– Rick

Copyright 2015 Rick Schwartz. All rights reserved. Linking to this article is encouraged. All of the comments in this blog are Rick’s alone, and do not reflect the views of his employer.
Follow me on Twitter @mostlytech1

Useful Links
Monsoon Tips
Hardware Power Measurement Best Practices

How to Measure Power Consumption Using Free Software

This article is the first in a series for mobile software developers. It is intended to help developers create apps with better battery life. Most developers don’t know if their app has a problem with excessive power consumption, because they don’t have an effective way to measure the amount of power their app consumes. If you can measure it, you can act on it. This article will focus on Best Practices for software power measurement. A subsequent article will show you how to measure power consumption using specialized hardware. Reducing power consumption results in longer battery life and happier users.

It's easy to measure the power consumption of a mobile device

It’s easy to measure the power consumption of a mobile device

There are two different ways to measure power on a mobile device. You can do it using hardware or software. I’ll cover the hardware-based method in a separate article. This post will focus on software-based power measurement. Trepn Profiler is an Android application that can display the real-time power consumption on a smartphone or tablet. I happen to work on the team who created it, but I that’s not why I include it in this article. I include it because it’s the only app I’ve found that reports accurate real-time power consumption. GameBench is a great app, but the current version has to run a few minutes before power data is reported. If you are aware of other app that report accurate real-time power, please mention them in the comments section below and I will include them in this article. Because Trepn runs on-target, your mobile device doesn’t have to be connected to a computer or special hardware in order to capture power data. You can use your phone on-the-go, and profile in the foreground or background. If you want to give it a try, Trepn is available as a free download from Google Play.

Here are just a few of the questions you can answer with software like Trepn Profiler:

  • Which Android video conferencing app uses less power: Google Hangouts, ooVoo, Skype, Tango or Viber?
  • Should I wait to download updates over Wi-Fi if my battery is low and I’m only getting two bars?
  • How much more power does a free app with ads consume over a paid app without ads?
  • Does a dark background really consume less power than a light one?
  • How much power do I save when I use hardware decoding on a high-resolution video file?
  • Does that new phone you’re considering buying consume more or less power than your current one?
  • What is the impact of settings on power consumption (e.g. do you save noticeable amounts of power when you turn off Bluetooth, Wi-Fi or 4G?)
  • Which activity consumes more power? Gaming or 4K video recording?


Before you start profiling, there are several things you should do to increase your chances of getting the most accurate power measurements possible.

Software Power Measurement Best Practices

Here are some best practices for measuring power with Trepn Profiler:

  1. Remove your USB cable – Trepn cannot display accurate power readings when your mobile device is charging or connected to a computer.

Tip: If you need a USB connection for device control and data transfer, use ADB over Wi-Fi as described here, but be aware it can cause power spikes that slightly increase your power readings.

  1. Make sure your device reports accurate battery power – How do you know if your device reports accurate battery power?  Battery power should appear in the list of data points in Trepn Profiler. After you check the “Battery Power” data point, touch the Back button and “Profile System.” Then go to “Stats” view.” You should see a value in the average power column when your device is idle between 400mW to 1000mW for smartphones with 4” to 5” screens, 700 mW to 2500mW for 6” smartphones or 7” tablets, and 2000mW to 4000mW for 10” or larger tablets. Devices that are known to report accurate battery power are listed here. If you see values like 0 or 1.80mW, your device cannot display accurate battery power.

awake

  1. Make sure your processor stays awake– To do this, check “Acquire Wakelock while Profiling” on the Trepn General Settings page. To illustrate the importance of this, I did two power tests Without forcing the processor to stay awake, the average power reading was 456mW. With a processor wakelock set, the power was 249mW. That’s an 83% error, which shows how important this setting can be. When the processor goes to sleep, data collection in Trepn may temporarily stop, or power readings can jump to levels that are lower or higher than they should be. When data collection stops for long periods, your average power readings will be higher than they should be, because Trepn will average any power spikes over a shorter time period. The only time you should not check “Acquire wakelocks…” is when you are using Trepn to test whether an app is keeping the processor awake by holding a partial wakelock.

asleep

  1. Minimize background processes/reduce system overhead – It’s not enough to close everything in Recent Apps. Open the Apps manager, go to Running and close all unneeded apps and stop all unneeded services.  How much power can background apps consume? I measured 1043mW power on my idle tablet before I closed all unused apps. After closing unused apps the power consumed dropped to 726mW. That’s a 30% reduction in power. Here are some recommendations how to minimize background activity:

    Minimize the number of apps you have running

    Minimize the number of apps you have running

      • Pure Android devices like the Nexus 5 or Nexus 7 are better for testing, because they have fewer preinstalled apps and less things running in the background.
      • Don’t check more data points than you need. This increases system resource consumption.
      • Make sure “Show Per-Application Statistics” is unchecked — unless you need to see the mobile and Wi-Fi data transmitted.
      • Profile in the background with no visible graphs or on-screen overlays. This results in almost half the power consumption, and more accurate power readings. After profiling, data can be viewed or saved so it can be analyzed later. Step-by-step instructions are listed here.
      • Pause or disable step counters like “S Health” or “Google Fit.” These apps can consume significant amounts of CPU cycles while your mobile device is idle.

    Turn off step-counters and always-listening apps like Google Now

    Turn off step-counters and always-listening apps like Google Now

      • Turn off ‘Google Now’ as follows: Turn off “Ok Google” Detection by going to Settings > Accounts > Google > Search > Voice. Select “Ok Google” detection and turn off ‘From the Google app’ and ‘From any screen.’ Turn off ‘Show cards’ under Settings > Accounts > Google > Search > ‘Now cards.’
      • Consider uninstalling apps like Microsoft’s “One Drive” or Nokia’s “Here” that relaunch themselves after you close them.

    Use  Quick Settings to turn off things like sync

    Use Quick Settings to turn off things like sync

    • Do not setup your device for use with multiple users.
    • Avoid using your device with a wearable, because they require that multiple apps are running at once and Bluetooth is always active.
    • Most popular apps have analytics that send data to the cloud periodically. To prevent this, turn on Airplane mode if your app doesn’t need to communicate with the cloud.
  2. Focus on what you’re measuring – Turn off everything that is not related to what you want to measure. If network connectivity is not needed, put your device in Airplane Mode. This will prevent your device from doing software updates in the background. Make sure Wi-Fi is off too. Some devices turn it off automatically when Airplane mode is enabled, others do not. Other things you may wish to turn off: Display (when possible), Ambient screen, Bluetooth, Location (GPS), Wi-Fi and Mobile networks (if not already in Airplane Mode).You may want to also turn off all syncing options under Settings > Accounts > Google. When performing screen power tests, set to processor to its lowest possible frequency to reduce effect of CPU on power.
  1. Be precise and test several times – It’s important that you are consistent and confirm your test results by retesting. Here are some suggestions how to do this:

    Dark backgrounds use much less power

    Dark backgrounds use much less power

    • Be very aware of your screen background. Light backgrounds use more power than dark backgrounds. How much more? The average power consumed by the Google News & Weather app with a light theme selected is 893 mW. With a dark theme selected, only 410 mW of power is consumed. That’s a power reduction of 54%.
    • Use a stopwatch to make sure your tests run the same duration every time.
    • When measuring average power consumption, profile for at least two minutes in Trepn Profiler’s Advanced Mode. Then save your results as a Trepn .db file. Touch the “Analyze Run” button and select the saved file. This will provide more accurate average values than the ones displayed while profiling.
    • Run each test at least two or three times and average the results. Throw out any values that are noticeably higher than the rest and retest. If you have a rooted device, consider using software like RepetiTouch to record your keystrokes. This will ensure your test runs are the same each time.
    • Keep everything as close to the same as possible on your tests, including background apps and services. After you finish a test, go back and check the running apps, if the list of apps is different, close the newly opened apps and test again.
  1. Minimize the impact of the screen – The display and its backlight are often the biggest consumers of power in a mobile device. 
  2. Always document screen brightness levels to make sure you are consistent.
  3. Turn screen brightness to the lowest possible level on your tests. Avoid using the Android Settings page to set screen brightness levels because the slider calibration varies from device to device. Also slider settings are not easily reproducible.
  4.  

    For rooted commercial devices (set brightness to 10):

    adb shell “su -c ‘echo 10 > /sys/class/leds/lcd-backlight/brightness'”


    For rooted MDPs:

    adb root
    adb wait-for-device
    adb remount
    adb shell “echo 10 > /sys/class/leds/lcd-backlight/brightness”

    1. Compare apples to apples – Don’t compare on-target measurements with off-target (e.g. Monsoon Power Monitor) measurements. On-target measurements and always going to be higher – sometimes significantly higher, so you cannot compare them with off-target measurements using hardware. However, when you run Trepn on a device connected to a Monsoon, you’ll find it’s very accurate (as shown in the chart below).

    Trepn is surprisingly  accurate -- even when compared to expensive hardware like the Monsoon Power Monitor

    Trepn is surprisingly accurate — even when compared to expensive hardware like a Monsoon Power Monitor

    After using Trepn, you should know exactly how much power your app consumes. Measure the power your app uses when idle and in-use and compare this with apps of the same type. A follow-up article will tell you how to reduce the power consumption of your app.

– Rick

Copyright 2015 Rick Schwartz. All rights reserved. Linking to this article is encouraged. All of the comments in this blog are Rick’s alone, and do not reflect the views of his employer.
Follow me on Twitter @mostlytech1

Software Power Measurement Best Practices

How to Protect Your Online Identity

Last updated: April 13, 2014

Snapchat just joined the long list of hacked sites

Snapchat just joined the long list of hacked sites [Image courtesy of TechCrunch]

UPDATE: The Heartbleed security bug makes all previous security exploits look all small. It has the potential to affect everyone, so it is important you protect yourself soon. See the Heartbleed section below, for a quick summary of the actions you need to take now.

Ever wonder why some people get their Facebook accounts hacked and others don’t? It’s because they use easy-to-guess passwords on multiple sites. Start the year out right by protecting your online data. It’s free and easy to do.

Gone in 60 Minutes

As our lives move to the cloud it’s important that we protect our online identities. If you’re like most people, you use the same password on multiple websites. This is a problem, because once a hacker gains access to one of your passwords, they can use it to access your other accounts. Imagine having a big part of your digital life erased by a hacker in less than an hour. This happened to a reporter last year. His first sign there was a problem was when his iPhone powered down and his iCloud restore didn’t work. Next, he found his Google account had been deleted and hackers used his Twitter account to send offensive messages. His problems weren’t just limited to his iPhone, the hacker gained access to his Apple account and remotely erased all of the data on his iPhone, iPad and MacBook. As bad as this was, it could have been worse. Since the hacker had access to his Amazon account, he could have bought thousands of dollars worth of merchandise or gained access to his online banking and financial accounts.

A Wired reporter had his entire digital life erased in less than an hour

A Wired reporter had his entire digital life erased in less than an hour

According to the victim, “one wouldn’t have to call Amazon to pull this off. Your pizza guy could do the same thing, for example. If you have an Apple ID, every time you call Pizza Hut, you’re giving the 16-year-old on the other end of the line all he needs to take over your entire digital life.” The reporter added that the Apple ID “has evolved into a single point of entry that controls my phones, tablets, computers and data-driven life. With this Apple ID, someone can make thousands of dollars of purchases in an instant, or do damage at a cost that you can’t put a price on.” He continued, “It’s shameful that Apple has asked its users to put so much trust in its cloud services, and not put better security mechanisms in place to protect them. Apple IDs are too easily reset, which effectively makes iCloud a data security nightmare.” This isn’t just an Apple and Amazon problem. The list of high-profile online security breaches includes Adobe, Evernote, Facebook, Gmail, LinkedIn, LivingSocial, Microsoft Xbox 360, Snapchat, Sony PlayStation, Twitter, UltraViolet and many more. Chances are you’ve used one of more of these hacked sites. Read more about the nine biggest security breaches of 2013.

73% of people use the same password for multiple sites

73% of people use the same password for multiple sites

Heartbleed: The King of All Exploits

    Although it’s not really new, a newly exposed bug called Heartbleed can reveal the username and passwords of many popular websites. As a result, it is recommended you change your password on all affected services after you confirm they have fixed their systems. This chart shows which sites have been affected. Also keep in mind that this vulnerability could have revealed more than just passwords, it could have allowed attackers to obtain information including credit card numbers, medical information, private emails and more.

    A 3-Step Solution

    1. Never use the same password for two sites – It’s essential you use unique passwords for every website. This isn’t as hard as it sounds because there is special software that keeps track of every password for you. This software automatically fills-in the correct username and password every time you visit a website. Although your browser can do this, your password data isn’t encrypted and can be easily viewed by anyone with access to your computer. A better solution is to use a cloud-based password locker like LastPass or 1Password. See the next section for tips how to setup a password locker.
    2. The 5 most common passwords

      The 5 most common passwords

    3. Use strong passwords – It’s hard to believe the most common password of 2013 was 123456. That’s not exactly hard to guess. Even if you create a password that has numbers, letters and special characters, it may not be strong enough that no one could guess it. Here is a website that will check your passwords to see how secure they are. If you need help creating strong passwords that avoid common mistakes check this out. Fortunately you won’t need to create your own secure passwords, your password locker software will do this for you.
    4. Backup your important data – It’s a good idea you backup all the important data on your computers and mobile devices. The easiest way to do this is to make sure all of your important documents, photos and other files are stored in folders that are synced with a cloud storage locker like Dropbox, SkyDrive or Google Drive. This backs up your data, and provides access your files from any smartphone, tablet or computer.

    LastPass detected that I had three different Adobe accounts that were compromised

    LastPass detected that I had three different Adobe accounts that were compromised

    Tips for a Smoother Transition

    Here are some tips that will make your transition into a more secure online world smoother.

    1. Start by installing free password locker software on all of your computers and mobile devices. Based on my research, LastPass is the best solution for Windows PC, Chromebook and Android users, while 1Password is the best solution for Mac and iOS users. If you decide to use LastPass, I recommend you use it with the Chrome browser.

      You’ll be asked to create a new password for your locker. I strongly recommend you use a long password you can easily remember — but have never used before. Here are some good tips how to do so. For example, you can easily convert the first part of the Gettysburg Address into a secure password that is easy to remember. “Four score and seven years ago our fathers brought forth” becomes “4Sa7yAoFbF.” Notice how I alternate capitalized letters and replace the numbers to make it more secure.

    2. After installing your new password locker software, I recommend you disable your browser’s built-in password manager. If you’re a Chrome user, click on the Chrome menu in the upper right-hand corner and select ‘Settings.’ Then scroll down and select ‘Show advanced settings/Passwords and Forms’ and make sure the two options below are not checked. I also recommend that you click on the ‘Manage saved passwords’ link and delete all of your saved passwords several weeks after you are confident your new password locker is working fine.
    3. Make sure to disable your broswer's built-in password manager

      Make sure to disable your browser’s built-in password manager

    4. Your password locker software will import all of your existing passwords, but you need to manually change them to secure passwords. I suggest you start by only changing a single password using your computer and the auto-generate password option on your password locker (e.g. LastPass). Since you’ll never need to remember or type your new secure passwords, I suggest you create passwords that are 12 characters long. Then, go to the site and make sure your password manager logs you in correctly. This is important because once you convert your passwords to secure passwords, you won’t be able to remember them.
    5. Here is the LastPass password generator

      Here is the LastPass password generator

    6. Next, you should try accessing the same site on your smartphone and tablet and make sure it logs you in as well. I’ve had some problems in this area. Here is how I handle this with LastPass:

      – For websites, I access the site using the LastPass app. After you log-in, you’ll be shown a list of websites. Select the site you want and touch ‘Launch.’ This should take you to the site and automatically log you in using your new secure password.

      – For mobile apps that require passwords like Evernote, I suggest you go to the your password locker app and copy the password first. Then open the mobile app and paste the password in the log-in screen. In most cases you’ll only have to do this once. The next time you open the app, it should remember the password for you.

    7. Once you are sure your password locker is working reliably on all of your devices, you should create new secure passwords for any of the sites listed above which have been hacked. Next, create passwords for the rest of your high-risk sites. This includes your online banking and other financial accounts, e-mail accounts, e-commerce sites (Amazon, eBay, Ticketmaster, etc.) and social media sites (e.g. Facebook, Twitter and LinkedIn). This is easier to do on your computer than your mobile devices. Once this is done, you can do this for lower-risk sites.

      Important: I can’t stress enough that you should copy and paste each new password you create to a temporary document that you keep around until you verify your password locker has correctly captured the new password and logs you in correctly. Although it doesn’t happen often, a few times I’ve had to manually copy and paste the new secure password into the password locker because it wasn’t automatically saved.

    8. When you’ve finished creating secure passwords for all your websites, use your password locker to run a security scan to identify remaining problems. You’re not done until you make sure that no two sites are using the same password and all passwords are secure.

    Congratulations! You’re Now Safe and Sound

    Your online data is now much better protected than before. It is now extremely unlikely that a hacker could log-in to your accounts as long as you keep the password to your password locker safe. If you want even more security, here are a few more extra tips. Back up your data to a NAS (or a large thumb drive) and store these backups outside of your home. Don’t store your credit cards with online merchants and lastly, consider using two-factor authentication for data that is really important to you. I’ll leave you with a few extra tips for mobile security. Have a safe new year!

    Extra tips to keep your smartphone secure

    Extra tips to keep your smartphone secure

    – Rick

    Copyright 2013-2014 Rick Schwartz. All rights reserved. Linking to this article is encouraged.


    Follow me on Twitter @mostlytech1

Debunking the Retina Display Myth

Last updated: August 10, 2014

Although Steve Jobs’ claims the human eye can’t perceive detail beyond 300 pixels per inch were immediately debunked, to this day almost everyone believes that what he said is still true. I became interested in this topic after seeing what I considered to be obvious differences between the highest-resolution smartphone displays. If Jobs’ claims were true, this shouldn’t have been possible. I wanted find out why I could see a difference, and whether it was possible to scientifically prove that Jobs’ retina claims were false. More importantly, I wanted to learn what specs would be needed in a real retina display. But before we can answer these questions, we need to go back to the beginning of this myth.

WWDC 2010 was where the Retina myth began

WWDC 2010 was where the Retina myth began

Looking Back

Back in June of 2010, Apple introduced the iPhone 4. Although no one knew it at the time, this would be Jobs’ last iPhone launch. The iPhone 4 was a landmark product because it was the first phone with a “Retina” display. Since few people correctly quote Jobs on this topic, let’s revisit what he said. Steve Jobs’ exact quote was “It turns out there’s a magic number right around 300 pixels per inch, that when you hold something around to 10 to 12 inches away from your eyes, is the limit of the human retina to differentiate the pixels.” This seemed plausible at the time because the display on the iPhone 4 was a big step forward. It had with four times the pixels of the previous model and a resolution of 326 pixels per inch (PPI).

Experts immediately questioned Jobs' retina claims

Experts immediately questioned Jobs’ Retina display claims

Experts Cry Foul

Almost immediately experts questioned Jobs’ claims. “Wired” ran an article saying the iPhone 4′s Retina display claims were “false marketing.” This article quoted Raymond Soneira from DisplayMate Technologies, who is one the most respected names in display analysis. Soneira said, “The math just doesn’t add up,” and suggested the term Retina display was misleading. Soneira went on to say “it was inaccurate to measure the resolution of the eye in terms of pixels.” He added “…a more accurate Retina definition would have a pixel resolution of 477 pixels per inch at 12 inches.”

Soneria was the first to attempt to prove Jobs was right

This blogger was the first to attempt to prove Jobs was right

Bad Math?

A blogger named Phil Plait then redid Soneira’s equations based normal vision, instead of perfect vision. Based on these calculations, Plait suggested Jobs’ claims were vindicated, but when you refer back to Jobs’ original quote, he refers to a distance of 10 to 12 inches. Plait conveniently used twelve inches, because that created the response he was looking for. Using a distance of ten inches, Plait confirmed that someone with normal vision could see visible pixels on a Retina display and the Retina display myth was busted. But that wasn’t the only problem with Plait’s and Soneira’s logic. There were several other problems we’ll discuss next.

A Flawed Definition of Perfect Vision

If you carefully read Plait’s article, you’ll see that he admits someone with perfect eyesight would be able to see a pixilated image when holding a Retina display one foot from their eyes. This backs up Soneira’s claim that 300 pixels aren’t enough for a true retina display, but there several problems with the definition of perfect vision. First, it is inaccurate to refer to 20/20 vision as “perfect” vision. 20/20 vision does not correspond to the best possible vision found in humans. Second, the word perfect doesn’t really make sense when applied to eyesight. The maximum acuity of a healthy human eye is 20/16 to 20/12. Even those with “bad” eyes can have 20/15 (or better) vision with glasses. This in itself doesn’t mean too much because the percentage of humans with better than 20/20 vision is relatively small (around 10-15% not including corrective glasses).

Most teens hold their phones close to their face

Most teens hold their phones closer to their face than adults

Screen Size Matters, Distances Vary

Contrary to the suggestions above, not everyone holds their mobile device 10 to 12 inches from their face. I’ve noticed that some teens hold their phones only 7 to 8 inches from their eyes. This is an important because the closer a person holds their screen, the higher the resolution required so the pixels effectively disappear. Jobs suggested that 300 pixels per inch was the magic number which determined whether a screen was a retina display, but the truth is there is no one single magic number for both smartphones and tablets. This is because the distance consumers hold tablets to their face is further away than they hold their smartphones. Some experts use a distance of 15 inches for tablets, but I often hold my tablet further away than that. What is the impact of this? It’s simple. The further you hold your device from your face, the lower the resolution needed for the pixels to disappear. This debunks the above assumptions that a single number can be used to determine whether a mobile device has a retina display or not.

20/20 has little to do with pixel recognition

Visual acuity alone is not the best predictor of pixel recognition

Primitive Measurements Don’t Cut It

The chart many eye doctors still use to determine whether you have 20/20 vision is a crude method that dates back to 1862. Eye charts were created to test vision, but we’re talking about something that goes beyond just text. We’re trying to determine whether a human can see the pixels on a display — and more importantly whether there is a benefit of using displays with resolutions higher than 300 PPI.

When trying to scientifically determine whether our eyes can tell the difference between two things, our eyes do a much better job telling the difference between two lines than they do interpreting characters of the alphabet. How much better? It turns out the ability of humans to distinguish between two different lines is actually ten times greater than 20/20 visual acuity. This is referred to as Vernier acuity and is the reason a Vernier scale like the one shown below allows users to measure things more precisely than using a uniformly-divided straight scale. You can prove this to yourself by taking this simple yet ingenious online test. This test proves that differences between Vernier lines can still be judged when the gap of a so-called “Landolt C” can no longer be recognized. In most cases the difference between these two is very large. That means while someone with excellent vision cannot recognize the orientation of the small “c” on the right (which has a 0.5 pixel gap size at normal reading distance), they can distinguish the gap between two lines that are only 0.05 pixels apart — that’s a 10x improvement.

The Vernier caliper uses Vernier acuity for more precise measurement

The Vernier caliper uses Vernier acuity for more precise readings

Science Still Matters

None of the experts quoted above attempted to scientifically test their assumptions. Plait claims his work calibrating for the Hubble telescope made him an expert in ophthalmology, but his real claim to fame was debunking the Moon landing hoax. I wondered what a real expert would say about this topic, so I did some research and found a study by Michael Bach. Mr. Bach is a professor at a German university known for their Ophthalmology-related studies and the former president of the International Society for Clinical Electrophysiology of Vision. Bach set out to test the limits of human vision and the ability to discern differences in extremely high-resolution displays. What he found and published in a scientific journal earlier this year clearly debunks Jobs’ retina display claims. His study had 49 subjects evaluate displays with resolutions between 254 and 1016 pixels per inch. The results of this study proves people can see the difference between a 339 PPI display and a 508 PPI display. More surprisingly, his study also suggests that some people can also discriminate between 508 PPI and 1016 PPI displays. So it’s clear the human eye is capable of benefiting from displays with more than 300 pixels per inch, but what is the minimum size for a true retina display and when will we be able to buy one?

The Real Retina Numbers?

Using the same equations Soneira and Plait used, a leading display manufacturer suggests a true retina smartphone display would need to have a resolution of at least 573 pixels per inch. However, this is for someone with perfect vision. The number is lower for someone with average vision. For a tablet held fifteen inches away from your eyes, and using the same equations, a true retina display would need a resolution that is higher than 382 PPI. Sadly, that means for people with perfect vision there are no true retina display smartphones or tablets available today. Even the new iPad Air only has a 264 PPI display. That doesn’t mean it doesn’t have a great looking display, but it doesn’t meet the definition of true retina display for a person with average vision.

Notice how the pixels of these four flagship phones vary

Notice how the pixels on four flagship phones vary. Source: AnandTech

All Pixels Are Not The Same

Now that we’ve established numbers for a true retina display, I want to point out one potential problem. When a mobile display goes under a microscope, it’s easy to see major differences between the types pixels used. The size varies, the shape varies, the placement varies. Even the color varies because some displays are now including white pixels (in addition to RGB). Some have pen-tile displays, others don’t. Even the type of displays used on popular smartphones vary. Companies like Samsung use OLED displays, while Apple uses LCD displays. Each has its own advantages and disadvantages. You can even see differences in the pixels on Samsung phones that have Super AMOLED displays. Unfortunately this topic is outside of the scope of this article. Just understand that all pixels are not the same and this makes it harder to come up with a single retina number that applies to all smartphones (or tablets). Other factors come into play as well, like the quality of your display. The better the quality panel, the more likely you are going to be able to see the differences we are discussing here.

Samsung recently shared their screen roadmap with analysts

Samsung recently shared their screen roadmap with analysts

Can You Really See A Difference?

Whether you can see a difference between your current smartphone and a smartphone with a true retina display depends on what you are viewing. Low-quality videos like the ones we watch on YouTube, will continue to look bad. In fact, they will even look worse, because you’ll see the compression artifacts more clearly. Small text is one area where you are likely to notice a difference. Text will be razor sharp. You can really see the difference between a 300 PPI display and 550 PPI display when things like pen-drawn Kanji characters are displayed. True retina tablets with screens that are 12 inches or larger will make it possible to get a newspaper-style experience, without reformatting articles. You will also be able to always use the full desktop versions of all websites and view high-resolution photos and 4K video with no loss of resolution. That’s not important today, but it will be in the coming years.

Much higher quality displays are coming in 2014

Much higher quality displays are coming in 2014

So When Can I Buy One?

True retina displays that are better than any Apple product are available now. The LG G3 has a 2560 x 1440 pixel smartphone display with a pixel density of 534 ppi. The Samsung Galaxy S5 LTE-A has a 5.1-inch display with an incredible 576 pixels per inch. That’s higher than the number required for a true retina smartphone display. Sadly it’s only available in Korea at this time. Samsung is also planning a 4K screen for smartphones. Assuming a screen size of around 5 inches, that works out to be about 880 pixels per inch.

4K tablet screens are coming as well. These screens should have resolutions over 400 pixels per inch, which exceeds the 382 PPI number required for a true retina display. Qualcomm demonstrated the first 4K Android tablet back in February of 2014. Reviewers like this one claimed its 3840-x-2160 display “easily beat the performance of the iPad Air.”

The Bottom Line

  • Researchers have proven people can see the difference between a >508 PPI display and a 339 PPI display.
  • It’s impossible to create a single number definition for a retina display because that number changes depending on the distance, your vision and other factors. Smartphones and tablets with much higher resolution displays are available now.
  • Apple mobile displays are no longer the best. Experts say the Galaxy S5 is the best performing Smartphone display that they have ever tested. As a result, Apple will finally increase the resolution of their mobile displays later in 2014.
  • Whether you can tell the difference between these new displays and today’s best displays will depend on the panel quality, distance and type of media you are viewing, but you won’t need a scientist to tell you they look great. Tablets will benefit the most, because their resolutions were significantly lower than smartphones.
  • – Rick

    Copyright 2013-2014 Rick Schwartz. All rights reserved. Linking to this article is encouraged. This article includes my personal opinions and does not reflect the views of my employer.


    Follow me on Twitter @mostlytech1

    Chromebook Tips – Part One

    Last updated: October 30, 2013

    This article is obviously not yet finished. Please stop by later to see the final version.

    Must-have Accessories for Every Chromebook

    Earlier this year I was given a Chromebook Pixel and fell in love with it. It’s not perfect, but is really good at some things. To find out what, please checkout my first article. The is the first in a series of articles containing tips and tricks for the Chromebook. We’ll be starting with accessories that every Chromebook owner should consider.

    A case protects your Chromebook from damage

    A case is the first thing you should buy for your Chromebook

    1. Protect your investment – Make sure to buy a case for your Chromebook before you scratch it. Keep in mind that most laptop sleeves will work just fine with your Chromebook as long as the screensize is the same. Another advantage of getting a case is the fact that it lessens the chances your Chromebook will slip out of your hands when you’re carrying it. Although there literally hundreds of sleeves that will hold your Chromebook on sites like Amazon. I recommend you spend a little more and get a nice case. You won’t regret it. It bought a high-quality sleeve from Timbuk2 that is padded and has venting which cools your Chromebook quickly. It was worth the extra money. Google also sells a nice hard case, but it’s not cheap. Make sure to confirm your Chromebook with fit in the case your considering before buying.
    2. Get ready to project – If you plan to use your Chromebook at work, you’ll want to make sure to get an adapter so you can connect it up to any projector. I purchased this low-cost Mini DisplayPort to VGA cable and it works fine.
    3. Go big (screen) – Although the Chromebook has a good quality display, it can’t compete with the 46″ LCD TV on your wall. It’s easy to connect your Chromebook to your TV to watch sports, YouTube videos or movies from Netflix or other online sources. To do this, you need to first determine whether your Chromebook as a Mini DisplayPort jack or a standard sized HDMI jack. If it doesn’t have an HDMI jack, you’ll want to get a long Mini DisplayPort to HDMI Cable. Although I’ve never had a problem, to be safe, you may want to turn off your TV before you connect or disconnect the HDMI cable.
    4. Stream without buffering – Steaming HD video over standard Wi-Fi often buffers. To eliminate the chance of buffering connect a Gigabit Ethernet network adapter to the USB port on your Chromebook. Once you plug-it in it will switch off Wi-Fi and connect you via Ethernet.
    5. Prevent slippage – Most chromebooks have a slippery metal bottom and can slide if you prop them up with your legs. If you have a problem with your Chromebook slipping you might want to try adding some Dycem feet to its bottom. Dycem grips better than anything else I can find. They make sheets of it, but that’s much more expensive than the feet that I use. I recommend you place six to eight of these on the bottom. These feet has eliminated my slippage problems.
    6. Clean your screen – Although you can keep your screen clean with any lint free cloth, for best results spend five bucks on a microfiber cleaning cloth.
    7. Buy an extra adapter – If you carry your Chromebook between home and work, or travel a lot, I recommend that you invest in a second AC adapter. It lightens the load of your backpack. Here is the adapter for the Chromebook Pixel. Here is a charger for Samsung Chromebooks.
    8. – Rick

      Copyright 2013 Rick Schwartz. All rights reserved. Linking to this article is encouraged.


      Follow me on Twitter @mostlytech1

    First Impressions – Samsung Galaxy Note 3

    Last updated: October 13, 2013

    I picked up a new Samsung Galaxy Note 3 the first day they were available and thought I would share my first impressions here. I was surprised I had to wait an hour before I could get help in my neighborhood Verizon store. The store was very full for a weeknight. There were at least four others picked up the same phone while I was there and one of them said he had been waiting all year for this phone.

    Transferring everything, from my old Samsung Galaxy S4 was relatively easy, once I removed the factory-installed SIM, which was buried under the MicroSD card slot. The person in the store had to use a razor knife to slide it out. After that, inserted my old SIM (containing all of my music and other stuff) and logged into my Google account. Now I was ready to give the new phone a test drive.

    The Galaxy Note 3 is a monster

    The Galaxy Note 3 is a monster


    Is This Phone Too Big?

    Most reviewers can’t get past the size of the Galaxy Note 3, but for anyone stepping up from a Galaxy S4, the transition isn’t a big deal. The phone is big, but still was easy to insert and remove from my front pocket. However, someone who wears very tight jeans might have a problem. The phone feels good when held with your hand. It’s thinner than the HTC One and Nexus 5. Although it’s 38 grams heavier than the Galaxy S4, the weight isn’t a problem. The advantages of the 5.7” screen are significant. Everything is better on a large screen (games, email, movies, Facebook, etc). Samsung’s split screen feature, which lets you run two different apps at once, is even more useful on this device. The one downside of the large screen is the fact that it’s hard to do everything with your thumb when holding the phone in one hand. Samsung has added some special one-hand commands, but I haven’t tried those yet.

    The Display

    The next thing you notice after the size of the phone is it’s display. The Galaxy Note 3 has the best looking mobile display I’ve ever seen. Although Galaxy S4 has a much higher pixel density (441 vs. 386). To my eyes, and those of some reviewers, the display on the Galaxy Note 3 looks noticeably better. Maybe that’s because it has the newest gen OLED display. I’m not sure, but in the store, it looked better than everything else — even the 469ppi display on the HTC One. The display on the Galaxy Note 3 incredibly sharp, and both black levels and contrast are outstanding. Although colors on the Galaxy Note 3 appear to be over-saturated DisplayMate says color accuracy is still good. If you want even better color calibration and accuracy, you can change the screen to “Movie Mode” under Settings. The screen on the Galaxy Note 3 is also extremely bright. In fact, DisplayMate says it’s the brightest mobile display they have ever tested.

    The screen on the Note 3 performs well in display tests

    The screen on the Note 3 performs well in display tests

    The Hardware

    Of course the Galaxy Note 3 is very fast. Its Snapdragon 800 processor seems to eliminate the Android lag I’ve experienced on other Android devices.

    Build-quality on the Galaxy Note 3 is better than the Galaxy Note II. I like the faux leather back, but am not a fan of the ridged chrome sides. Although its build quality pales in comparison to an HTC One or iPhone 5, I’d rate it good overall. The speaker on the Galaxy Note has been moved from the back to the bottom on the phone. That was a smart decision. Although Samsung isn’t known for their speaker quality, I was surprised to find its one speaker sounds good and has some bottom as well. It also gets surprisingly loud.

    I like the new wider USB 3.0 cable, it is easier to insert and feels more solid. I was surprised to find that Samsung ships the same AC adapter with the Galaxy Note 3 and Galaxy S4. Both are rated for 2A. I expected a higher current charger, because USB 3.0 supports that.

    The Galaxy Note 3 comes with a generous 32GB, which can be inexpensively expanded to 64GB (or more)

    The Galaxy Note 3 comes with 32GB, but can be inexpensively expanded to 64GB (or more)


    Battery Life

    Battery life is good — considering Verizon is shipping this phone with the screen brightness turned up almost all of the way. Even with the screen brightness at 95%, I was still able to go 7.5 hours under moderate use and had about 30% of battery remaining.

    The decision to ship this phone with at least 32GB of storage was a smart. Samsung was dinged for using up so much of the storage on the 16GB Galaxy S4 (only 9.5GB of space was left for users). Android uses up 6.73GB of the available 32GB on the Galaxy Note 3. Even after installing 100+ apps and photos, I still have over 23GB of internal storage available. When you first launch the camera, it asks if you want to store your photos on the MicroSD card (like the Galaxy S4), however I’ve stopped doing that because I’ve found some apps have problems with this.

    The Software

    As far as software goes, there are several new pen apps. So far I haven’t found any killer application for the pen, but it’s too soon to say it isn’t useful. There are now folders in the App Locker for Verizon, Google and other categories, which makes it look like there isn’t so much bloatware on this device. Although you can no longer hide apps in the App Locker, you can now disable apps by dragging them from the locker to the trash can. The default keyboard is much improved over the one in the Galaxy S4. It’s even better than SwiftKey in some ways (has a .com key and wider key spacing). On the downside, Samsung has completely changed the Settings screen again, which makes it harder to find things.

    The camera on the Note 3 is good, but not the best

    The camera on the Note 3 is good


    The Camera

    The camera on the Galaxy Note 3 seems good so far in my limited testing. I tried recording some Ultra HD video and that looks really good as well. I was pleased you can watch those videos on the Galaxy Note 3’s 1920×1080 screen — even though they are 3840×2160. The video stabilization features seems to work pretty well, although it’s not available on Ultra HD video. It’s worth mentioning that I was able to crash the Camera app once or twice.

    The Bottom Line

    So the bottom line is, I really like the Galaxy Note 3 so far, the screen size hasn't been a problem for me and the display is wonderful. I wish it didn't have so many carrier-installed apps and almost went with he Nexus 5 for that reason, but it has enough storage that it doesn't seem to be too much of a problem. There are enough differences between the Galaxy Note 3 and the Galaxy S4 that I would recommend this phone to Galaxy S4 users. Make sure you play with this phone before you buy it to make sure it's size isn't a problem for you. I think the large screen is nice, but it's not for everyone.

    – Rick

    Copyright 2013 Rick Schwartz. All rights reserved. Linking to this article is encouraged.


    Follow me on Twitter @mostlytech1